STORM SWEEP
A Free Weather Radar Workstation for Windows
Storm Sweep reads raw NEXRAD Level II straight from the NOAA archive and renders it on your own PC: dual-pol products at every tilt, in up to four linked panels, on one shared timeline. Alongside it: the same volume in 3D, GOES satellite, four forecast models decoded here rather than downloaded as pictures, eight forecasting tools, aviation and drone planning, marine forecasts, a Current Weather map, NOAA’s long climate records, a satellite tracker, space weather and radio-propagation maps, and National Weather Service alerts that keep watching after you close the window. A built-in Learn The Weather course explains every radar product and teaches you to read satellite, models, soundings, aviation and marine weather, with steps you try in the app.
Every feature is free. There is no paid tier, no trial, no sign-in and no advertising.
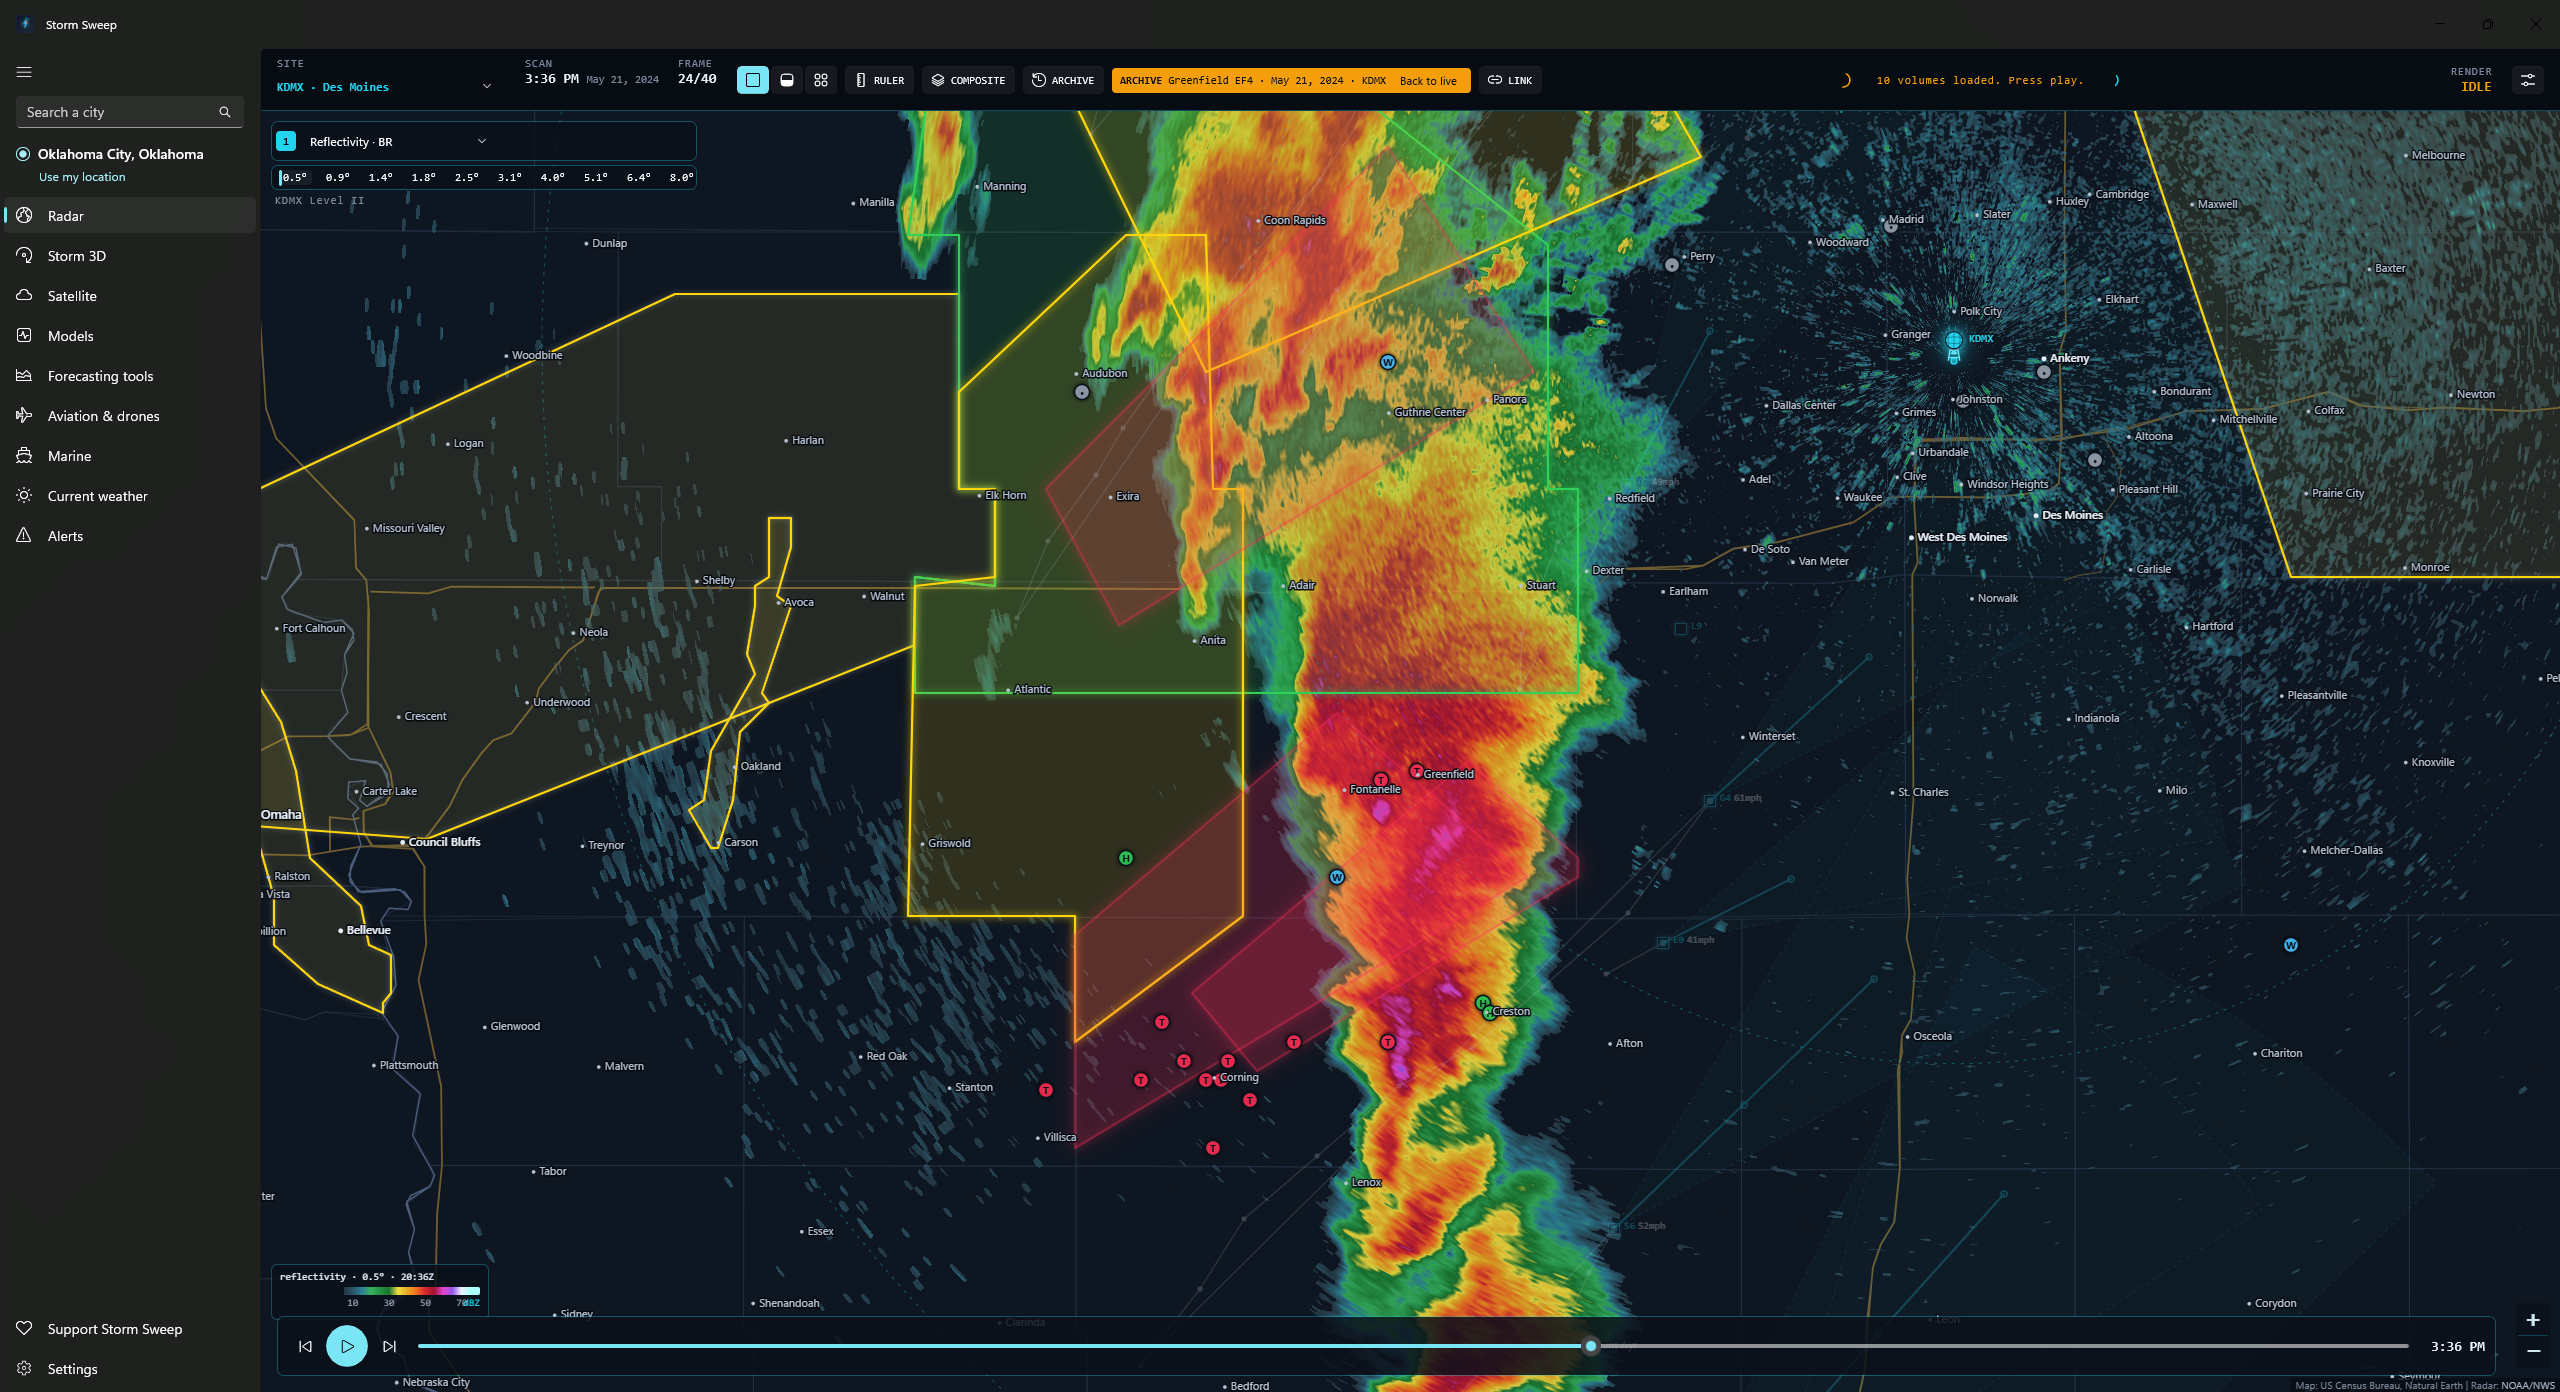
A desktop NEXRAD workstation
Raw Level II straight from the NOAA archive, decoded and drawn on your own PC. Not a picture of radar someone else rendered for you. NOAA’s own rendered mosaic and its latest-scan hail class sit a panel away when you want them.
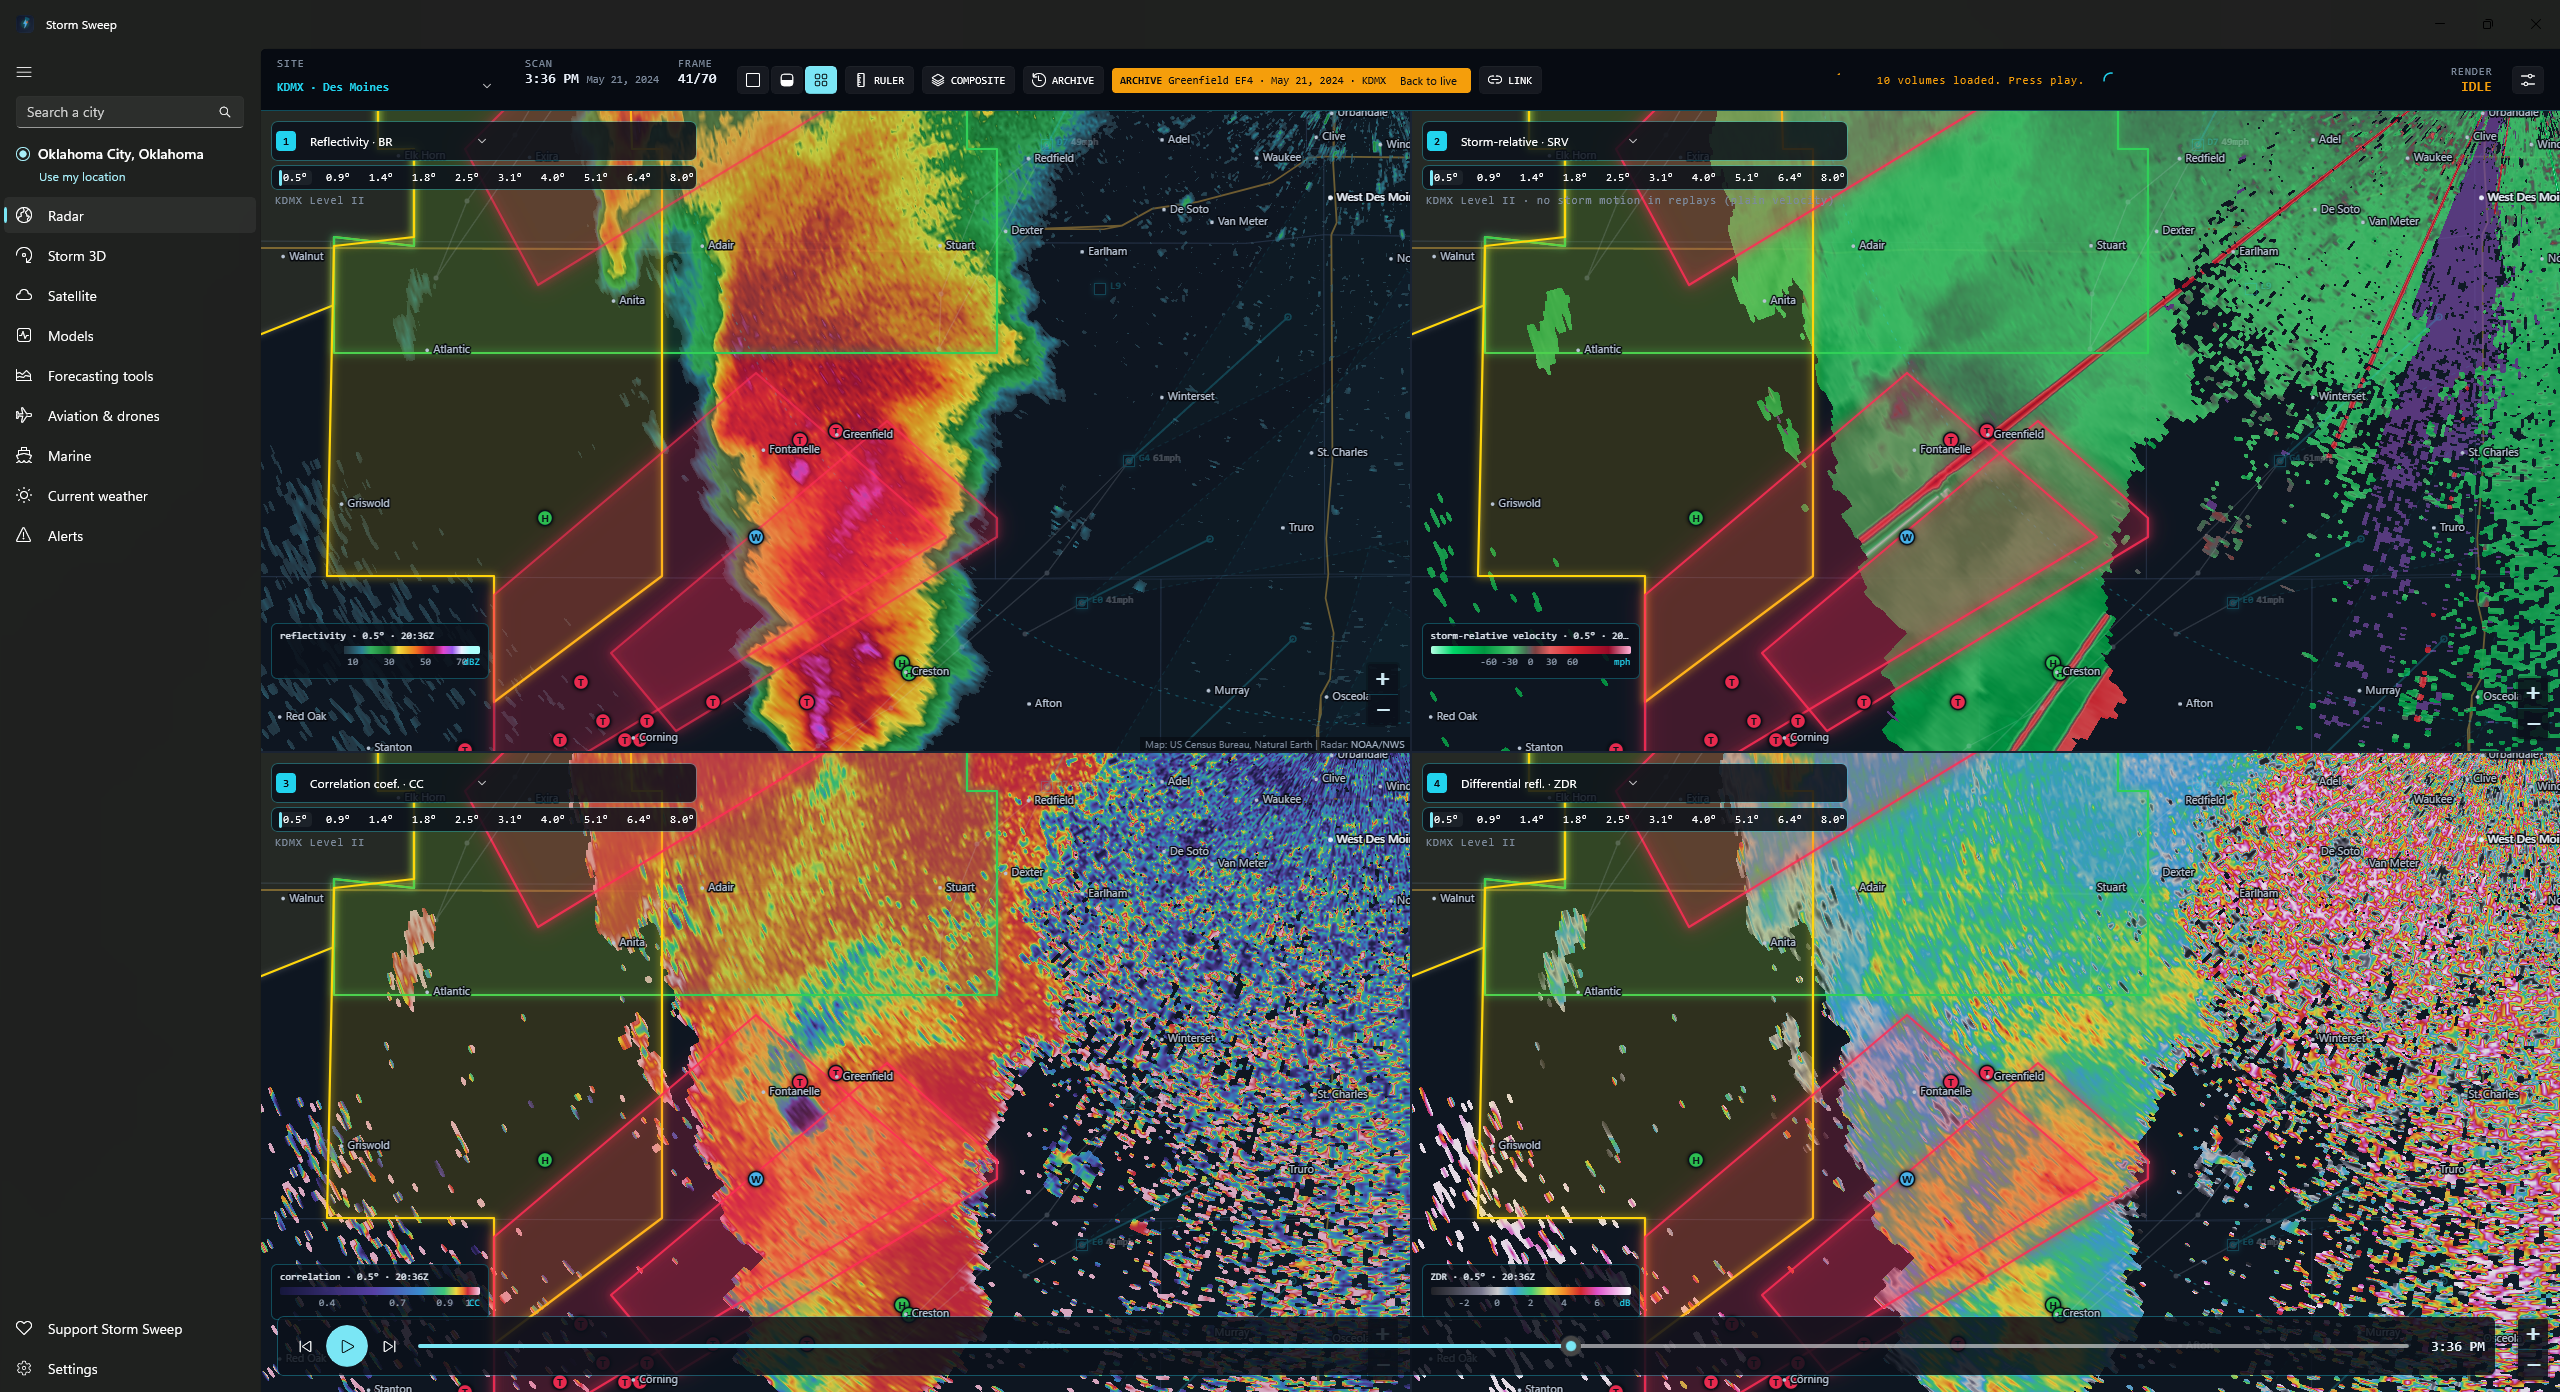
Level II products at every tilt
Reflectivity, velocity, storm-relative velocity, spectrum width and, on any volume the radar recorded them in, differential reflectivity, correlation coefficient and specific differential phase. Storm-relative velocity is dealiased, and the motion subtracted comes from the radar’s own storm tracks or, failing those, the HRRR mean wind; KDP is computed on your PC from the raw phase data. A tilt strip under each of those panels lists the elevation angles in the newest volume so you can climb through a storm. The full set needs a NEXRAD: about 45 of the roughly 200 sites in the list are the FAA’s airport TDWRs, which publish only reflectivity and velocity at their three lowest tilts; there, spectrum width and the three dual-pol products give way to the national mosaic, and storm-relative velocity falls back to that plain velocity, which the radar never dealiased.
One, two or four panels, one timeline
Split the workspace into 1, 2 or 4 panels, each with its own product and tilt, all stepping through the same moment. Link them so panning moves everything, or unlink to compare different parts of a storm. Live, that timeline holds the newest six volumes: about 25 to 35 minutes on a NEXRAD, and about six minutes on a TDWR, where each roughly one-minute scan counts as a volume. Anything further back is the archive replay’s job.
Archive replay back to June 2008
Pick any past date and local time at a NEXRAD site with a 1, 2 or 3-hour window, or load one of five built-in cases: Moore 2013, El Reno 2013, Joplin 2011, Rolling Fork 2023, Greenfield 2024. The warnings in force at the middle of that window, and the storm reports filed within 600 km of the radar across it, come back with it from the Iowa Environmental Mesonet archive. Storm tracks, tornado vortex signatures and mesocyclone detections come back only for cases from 2020 on, as far back as the Level III archive Storm Sweep reads goes, so Joplin, Moore and El Reno replay without them, and the app says on screen that the tracks are missing.
Where a replay differs from live
A few things work live only. The hail size estimate and severe-hail chance need that day’s freezing level, so those panels stay blank. NOAA’s hail class is a single image of the station’s latest scan, live only, and it does not step with the loop. Storm-relative velocity falls back to plain velocity, because a replay works out no storm motion to subtract, and live it does the same whenever neither the radar’s storm tracks nor the HRRR mean wind can supply one; outside HRRR’s lower-48 grid the model cannot, so the Alaska, Hawaii, Puerto Rico, Guam and overseas sites depend on the radar’s own tracks alone. Each of those carries a panel note saying so.
Dual-pol is only there if the radar had it: NEXRAD was upgraded site by site between 2011 and 2013, so a case from before its site’s upgrade carries no differential reflectivity, correlation coefficient or specific differential phase, and those panels come up empty with no note to explain it. A replayed case’s warnings come back from the archive as their tornado, hail, wind and damage tags plus a link to the issued text, so the statement pane holds no narrative and no what-to-do instruction.
NOAA’s national mosaic loop has no archive history either, so a panel left on the mosaic (or on hail class, which gives way to it) has nothing to draw over a case. A window holding more than forty volumes is loaded as at most forty, spread evenly across its length, and the status line says how many of how many it took.
Volume-derived products
Echo tops at 18 and 50 dBZ, vertically integrated liquid, VIL density, hail size estimate and severe-hail chance, all computed from every tilt of the whole volume and drawn like any sweep, out to 230 km, half a reflectivity sweep’s reach, because past that the lowest beam overshoots the storm. They need a full NEXRAD volume, at least five tilts, so on a TDWR they give way to the national mosaic instead. Each of those panels is labelled a Storm Sweep estimate, computed here from the volume rather than issued by the Weather Service.
Hail estimated on your PC
NOAA stopped publishing its hail index to the public archive in 2022, so Storm Sweep runs the published NWS Hail Detection Algorithm itself (probability of hail, probability of severe hail and maximum expected size) using current freezing and −20 °C heights from HRRR’s lower-48 grid. At sites outside that grid (Alaska, Hawaii, Puerto Rico, Guam and the overseas base radars), those estimates are not computed at all. Labelled as a Storm Sweep estimate wherever it appears; NOAA’s own hail class is a separate panel and is not this estimate.
Warnings you can actually read
Tornado, severe thunderstorm, flash flood and the other polygon alerts the Weather Service marks severe or extreme, drawn on every panel with the most severe on top. The overlay goes by that severity rather than by product, so lesser advisories are not part of it, and alerts issued by zone code carry no polygon to draw; the Alerts tab lists those, and can send any alert that does have a polygon over to the radar. Click a live warning’s polygon and the full statement opens beside the map, including the what-to-do instruction.
A home marker you place yourself
Right-click the map, or press H, to place a home marker, then move or remove it from the same menu. It shows on every radar panel and on the Current Weather map, and is kept on this PC only, separate from your saved place.
Colour tables, with colour-vision versions
Reflectivity opens on Storm Sweep’s own table, with the NWS standard scale one click away; velocity, ZDR, CC, KDP and spectrum width have Storm Sweep tables too, and every built-in Storm Sweep table has red-green and blue-yellow friendly versions. Warnings and storm reports open on click.
A hint under every product
The product lists in the Radar panel and in both Storm 3D pickers show a one-line plain-English hint under each product, such as “Whether targets are wider than tall: big flattened drops read high” for ZDR. Hail sizes and chances are labelled as Storm Sweep’s estimate.
Radar station status
When the radar you chose is running late the station turns orange, and when it is offline it turns red. A “Use nearest working radar” button switches you to the closest site that is reporting. The “Parts of the radar loop didn’t load” banner now appears only when several map tiles fail, not for one stray tile.
Times in your own clock
The Models time card, satellite frames, soundings, the radar legend and Storm 3D show your local time with your time zone, for example 3:00 PM CDT, and model runs are named by your local hour, such as “1 PM run”. Model runs and soundings keep their short UTC name (such as 18Z) in small print, satellite frames carry the UTC scan time on a line below, and the Time section of Settings can add UTC beside the rest.
The detail: rendering, tracks, composites, display settings, TDWR limits
How far back the live loop runs
Live radar keeps the newest six volumes and checks for a new one every two minutes: about 25 to 35 minutes of loop on a NEXRAD, and about six minutes on a TDWR, where each roughly one-minute scan counts as a volume. Anything further back is the NEXRAD archive replay’s job.
Per-pixel GPU rendering
A WebGL2 shader turns every screen pixel back into a range and bearing from the radar using the standard 4/3-earth beam model. The picture stays sharp at any zoom instead of turning into blurry tiles.
SAILS rescans kept, not discarded
When a radar rescans its lowest tilt mid-volume, each rescan becomes its own step on the timeline, so the low-level loop runs at the rate the radar actually produced.
Storm cells with motion cones
SCIT storm cells plotted with their past track, 15-minute forecast positions, id and speed, plus an hour-ahead cone fifteen degrees either side of the heading. The layer fades when the frame on screen drifts more than ten minutes from the tracks.
Display settings
A side panel sets the sweep opacity, the loop speed (2, 4 or 8 frames a second) and whether playback blends between frames or steps frame by frame, and switches the severe-warning overlay and the storm layers off. A separate switch draws street and highway names from the USGS National Map over the radar once you zoom in past street level; the rest of the base map is bundled.
NOAA’s rendered layers
A panel can show NOAA’s own pictures instead of raw sweeps: the national base-reflectivity mosaic as a two-hour loop at five minutes a frame, and the chosen station’s hydrometeor classification (NOAA’s hail class, not the Storm Sweep estimate) for its latest scan. Both are live only, with no archive history.
The mosaic is also what a panel falls back to when no NEXRAD is in range, and when a TDWR cannot supply the product you picked. Over a replayed case the mosaic has no frames of its own, so a panel on the mosaic, or on hail class, stays blank.
Multi-radar composite
Merge a NEXRAD site with up to three more into one loop. Auto slots pick the nearest radar within 400 km, or choose sites yourself; where coverage overlaps you decide whether radars are blended (the default), the nearest radar’s lowest beam wins or the strongest echo does. Lowest-tilt reflectivity only.
TDWR airport radars
The FAA’s Terminal Doppler Weather Radars drive the same panels, using their three lowest tilts of reflectivity and velocity at 0.15 km bins out to 89 km, refreshed about once a minute.
They are single-polarization and NOAA publishes them only as Level III, so reflectivity, velocity and storm-relative velocity are all that work: spectrum width, the dual-pol products and the volume-derived products give way to the national mosaic, storm-relative velocity falls back to that plain velocity, which the radar never dealiased, and a TDWR has no archive replay and cannot join a composite.
Pick one from the site list, where they are marked (TDWR). “Nearest to my location” only ever chooses a NEXRAD.
Your own colour tables
Storm Sweep’s own dark-map reflectivity table is the default, and the standard NWS scale is one click away. You can also load the GRLevelX-style .pal files you already have. Reflectivity, velocity, SRV, CC, ZDR, KDP and spectrum width are all supported, with velocity units converted automatically.
Tornado vortex signature, mesocyclone and local-storm-report overlays, range rings, a two-click ruler and a live cursor readout with beam height are all included; the tornado-vortex-signature and mesocyclone overlays are one set of detections from the newest scan rather than a frame-by-frame layer, and they fade when the frame on screen is more than ten minutes from them. “Nearest to my location” looks for a NEXRAD within 460 km and shows the national mosaic when there is none; that mosaic covers the lower 48 only. Storm Sweep is not an official warning system. The polygons it draws are the Weather Service’s, so keep a NOAA Weather Radio or Wireless Emergency Alerts on and follow local officials.
The same volume, in three dimensions
A box cut from the radar volume you are already looking at, rebuilt as a solid you can rotate from overhead down to the horizon, slice and peel back a layer at a time. Heights are stretched to make the structure legible (×3 by default, with ×1, ×2 and ×5 a click away), so the solid stands taller than the real storm, while the figures the readout and the cell tags quote are the real heights above the radar antenna.
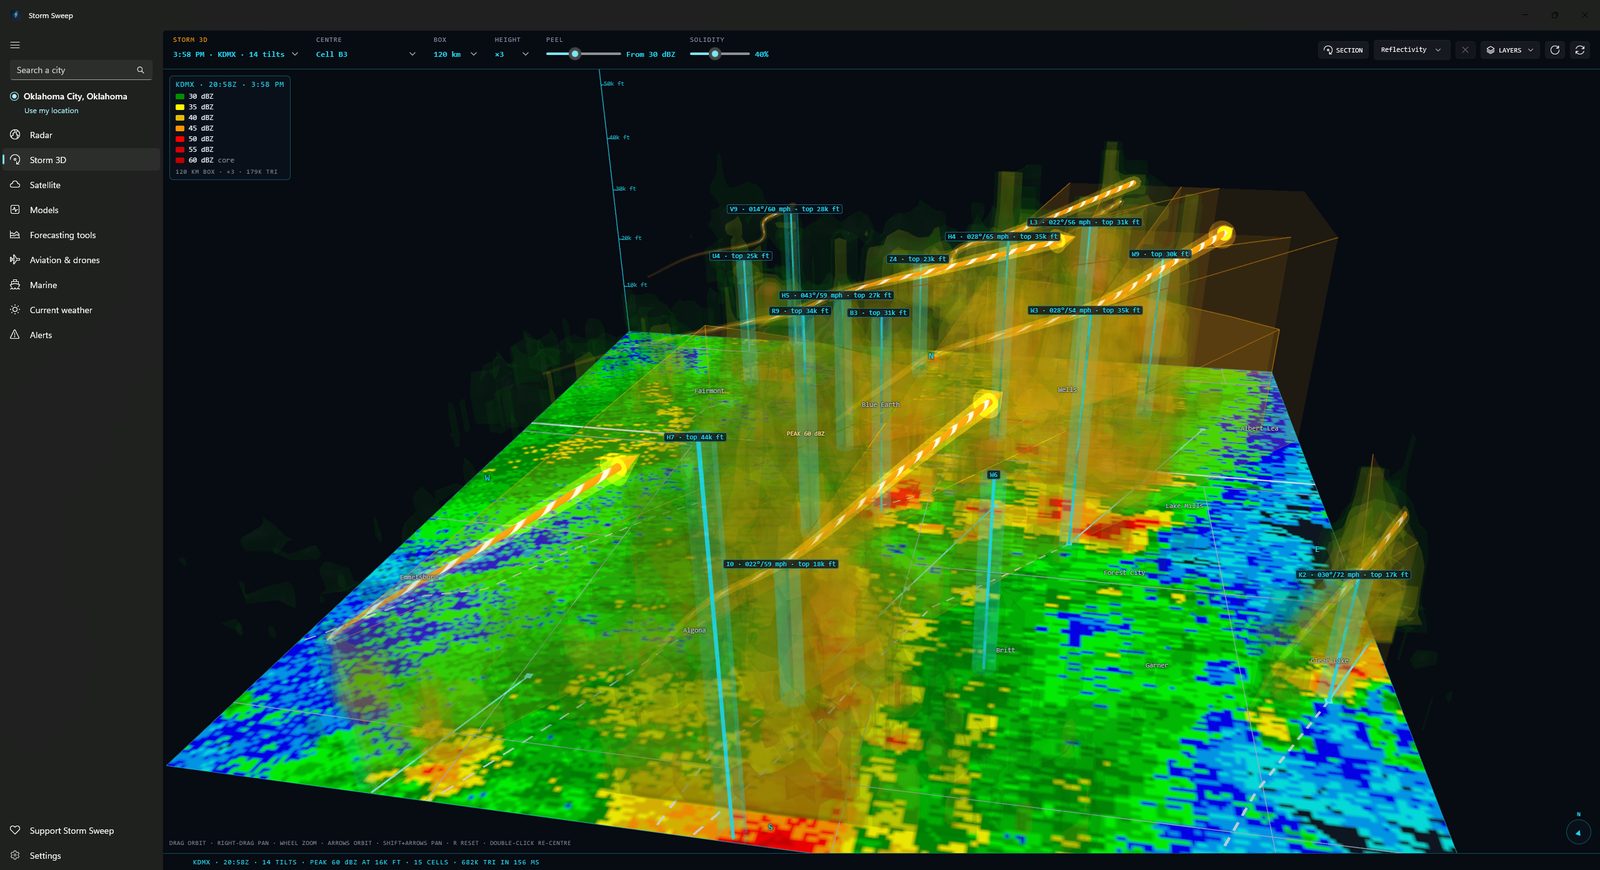
Built from the volume you pick
The 3D view uses the same Level II volumes as the radar tab, so what you rotate is the storm you were just watching, not a separate or delayed product. What it rebuilds is a box 60, 120 or 200 km wide and 18 km tall, centred on the strongest echo, on the radar, on a storm cell you pick from the list or on any point you double-click, not the radar’s whole range. A picker lists the volumes by time, site and tilt count, so any step of the loop can be rebuilt, not just the newest; the loop is the radar tab’s own, and Storm 3D opened by itself holds only the newest volume until you have been watching Level II there. One radar at a time. There is no 3D version of the multi-radar composite.
Isosurfaces you choose
The peel slider sets the weakest echo drawn, from 10 to 65 dBZ in 5 dBZ steps. Storm Sweep builds a shell at that value and at every 5 dBZ above it, up to twelve nested surfaces in the app’s own reflectivity colours, with the strongest one present drawn solid as the core and marked that way in the legend; a shell too large for one mesh is drawn in part, and the status line says so and suggests a smaller box. Drag right to strip the outer layers off down to that core, and use the separate solidity slider to set how see-through the layers around it are, from ghostly to nearly solid.
Three view styles, and a Lighting panel
Draw the storm as Layered shells, a Single surface (with a “Surface at” slider) or a Glow cloud, which needs WebGL 2. A Lighting panel sets whether the light follows your view or the map, its direction and height, and the shading from soft to sculpted, and your choices are saved. A cutaway option opens the storm on your side of the slice.
Velocity and dual-pol, not just reflectivity
A “Show” picker switches the shells between Reflectivity, Velocity, ZDR, CC, KDP and Spectrum width, each with its own control: speed for velocity (inbound green, outbound red), ZDR, CC with a reflectivity mask, KDP and width. A separate “Cross-section shows” picker chooses the field for the vertical slice. KDP is worked out by Storm Sweep where correlation is high and the echo is 20 dBZ or stronger, and is labelled that way.
Slice it where you want
Turn on the section tool and click two points: on the ground or on the storm itself. Storm Sweep cuts a curtain of the field you choose (reflectivity, velocity, spectrum width or a dual-pol field) from A to B through the volume, ground to the top of the box, and draws it both inside the box and in a panel across the bottom of the view, with a height axis every 10,000 ft and range in miles from A. One straight section at a time, and if the volume carries no velocity the app says so instead of drawing something.
Storm cells as columns
The radar’s SCIT storm cells stand in the box as columns rising to the height where reflectivity drops through 30 dBZ, or to a default 8 km where the volume never reaches the storm’s top. A column is cyan, amber for a mesocyclone, red for a tornado vortex signature, and carries a tag with the cell id, the direction and speed where the radar reports the cell a motion, the measured top in feet above the radar antenna, and, only where the radar tab has already computed them, a peak dBZ and hail figures. The cells, their tracks and the mesocyclone and tornado-vortex-signature flags are the radar’s published Level III storm products: live, they are drawn on the newest volume, and products more than half an hour old are left out. The hail figures are the radar’s own hail index wherever it still publishes one. Where it does not, those figures and the peak dBZ beside them are Storm Sweep’s own run of the published NWS Hail Detection Algorithm over the volume, which needs the HRRR model’s freezing levels: that estimate covers the lower 48 only, and a cell closer than 5 km or farther than 230 km from the radar gets none.
The detail: layers, view controls and exaggeration
Following the newest volume
While the view is open on live data it checks for a newer volume every two minutes and moves on to it if you were following the newest; a historic case rebuilds the same way, from the volumes the case already loaded.
Moving the cut
Drag either end to move the cut, or hover the panel to read the value under the cursor.
Tracks, cones and the hour ahead
A tapered arrow at the column’s top runs back along as much of the cell’s Level III past track as the arrow itself is long (a short straight stub where the radar publishes no past track), then thirty minutes forward along its reported motion, with both tracks also drawn on the ground, and the hour-ahead cone, fifteen degrees either side of the heading, extruded from the ground to the top of the column.
Ground, basemap and echo top
The lowest tilt lies on the floor of the box, with state and county lines drawn over it and up to forty town names placed in the view, so a storm sits over somewhere recognisable. An optional surface traces the 18 dBZ echo top, coloured by height in thousands of feet above sea level. One flyout switches the ground, the lines, the storm columns and that surface on or off, along with a slow auto-spin.
The pointer readout and the view controls
Point at the storm and a card reads back the value under the pointer (dBZ, or inbound and outbound speed on a velocity section), with the height in feet and kilometres above the radar antenna and the range and bearing back to it. Drag to orbit, right-drag to pan, wheel to zoom; the arrow keys orbit, Shift with them pans, + and − zoom and R resets the view.
Vertical exaggeration
Storms are far wider than they are tall, so a true-scale view hides the features worth seeing. Four fixed settings, ×1, ×2, ×3 and ×5, and everything in the box follows together: shells, echo tops, the section curtain, storm columns and the height pole.
The cell tags’ peak dBZ, and their hail figures wherever the radar publishes no hail index of its own, are Storm Sweep estimates rather than issued NWS products, and the arrow ahead of a column and the hour-ahead cone, drawn only for a cell the radar reports a motion for, are Storm Sweep’s own extrapolation of the cell’s reported motion rather than an NWS warning or forecast. Storm 3D needs a deep volume to be honest about height: a NEXRAD scan with at least five tilts. A TDWR airport radar, with only three low tilts, and any volume with fewer than five are refused with a message saying why rather than drawn with a flat top. The view needs WebGL2, like the radar and model maps, and says so plainly on a PC that cannot provide it.
GOES imagery, looped and zoomable
GOES-19 and GOES-18 imagery from NOAA STAR, looping in the same app as your radar rather than in a browser tab.
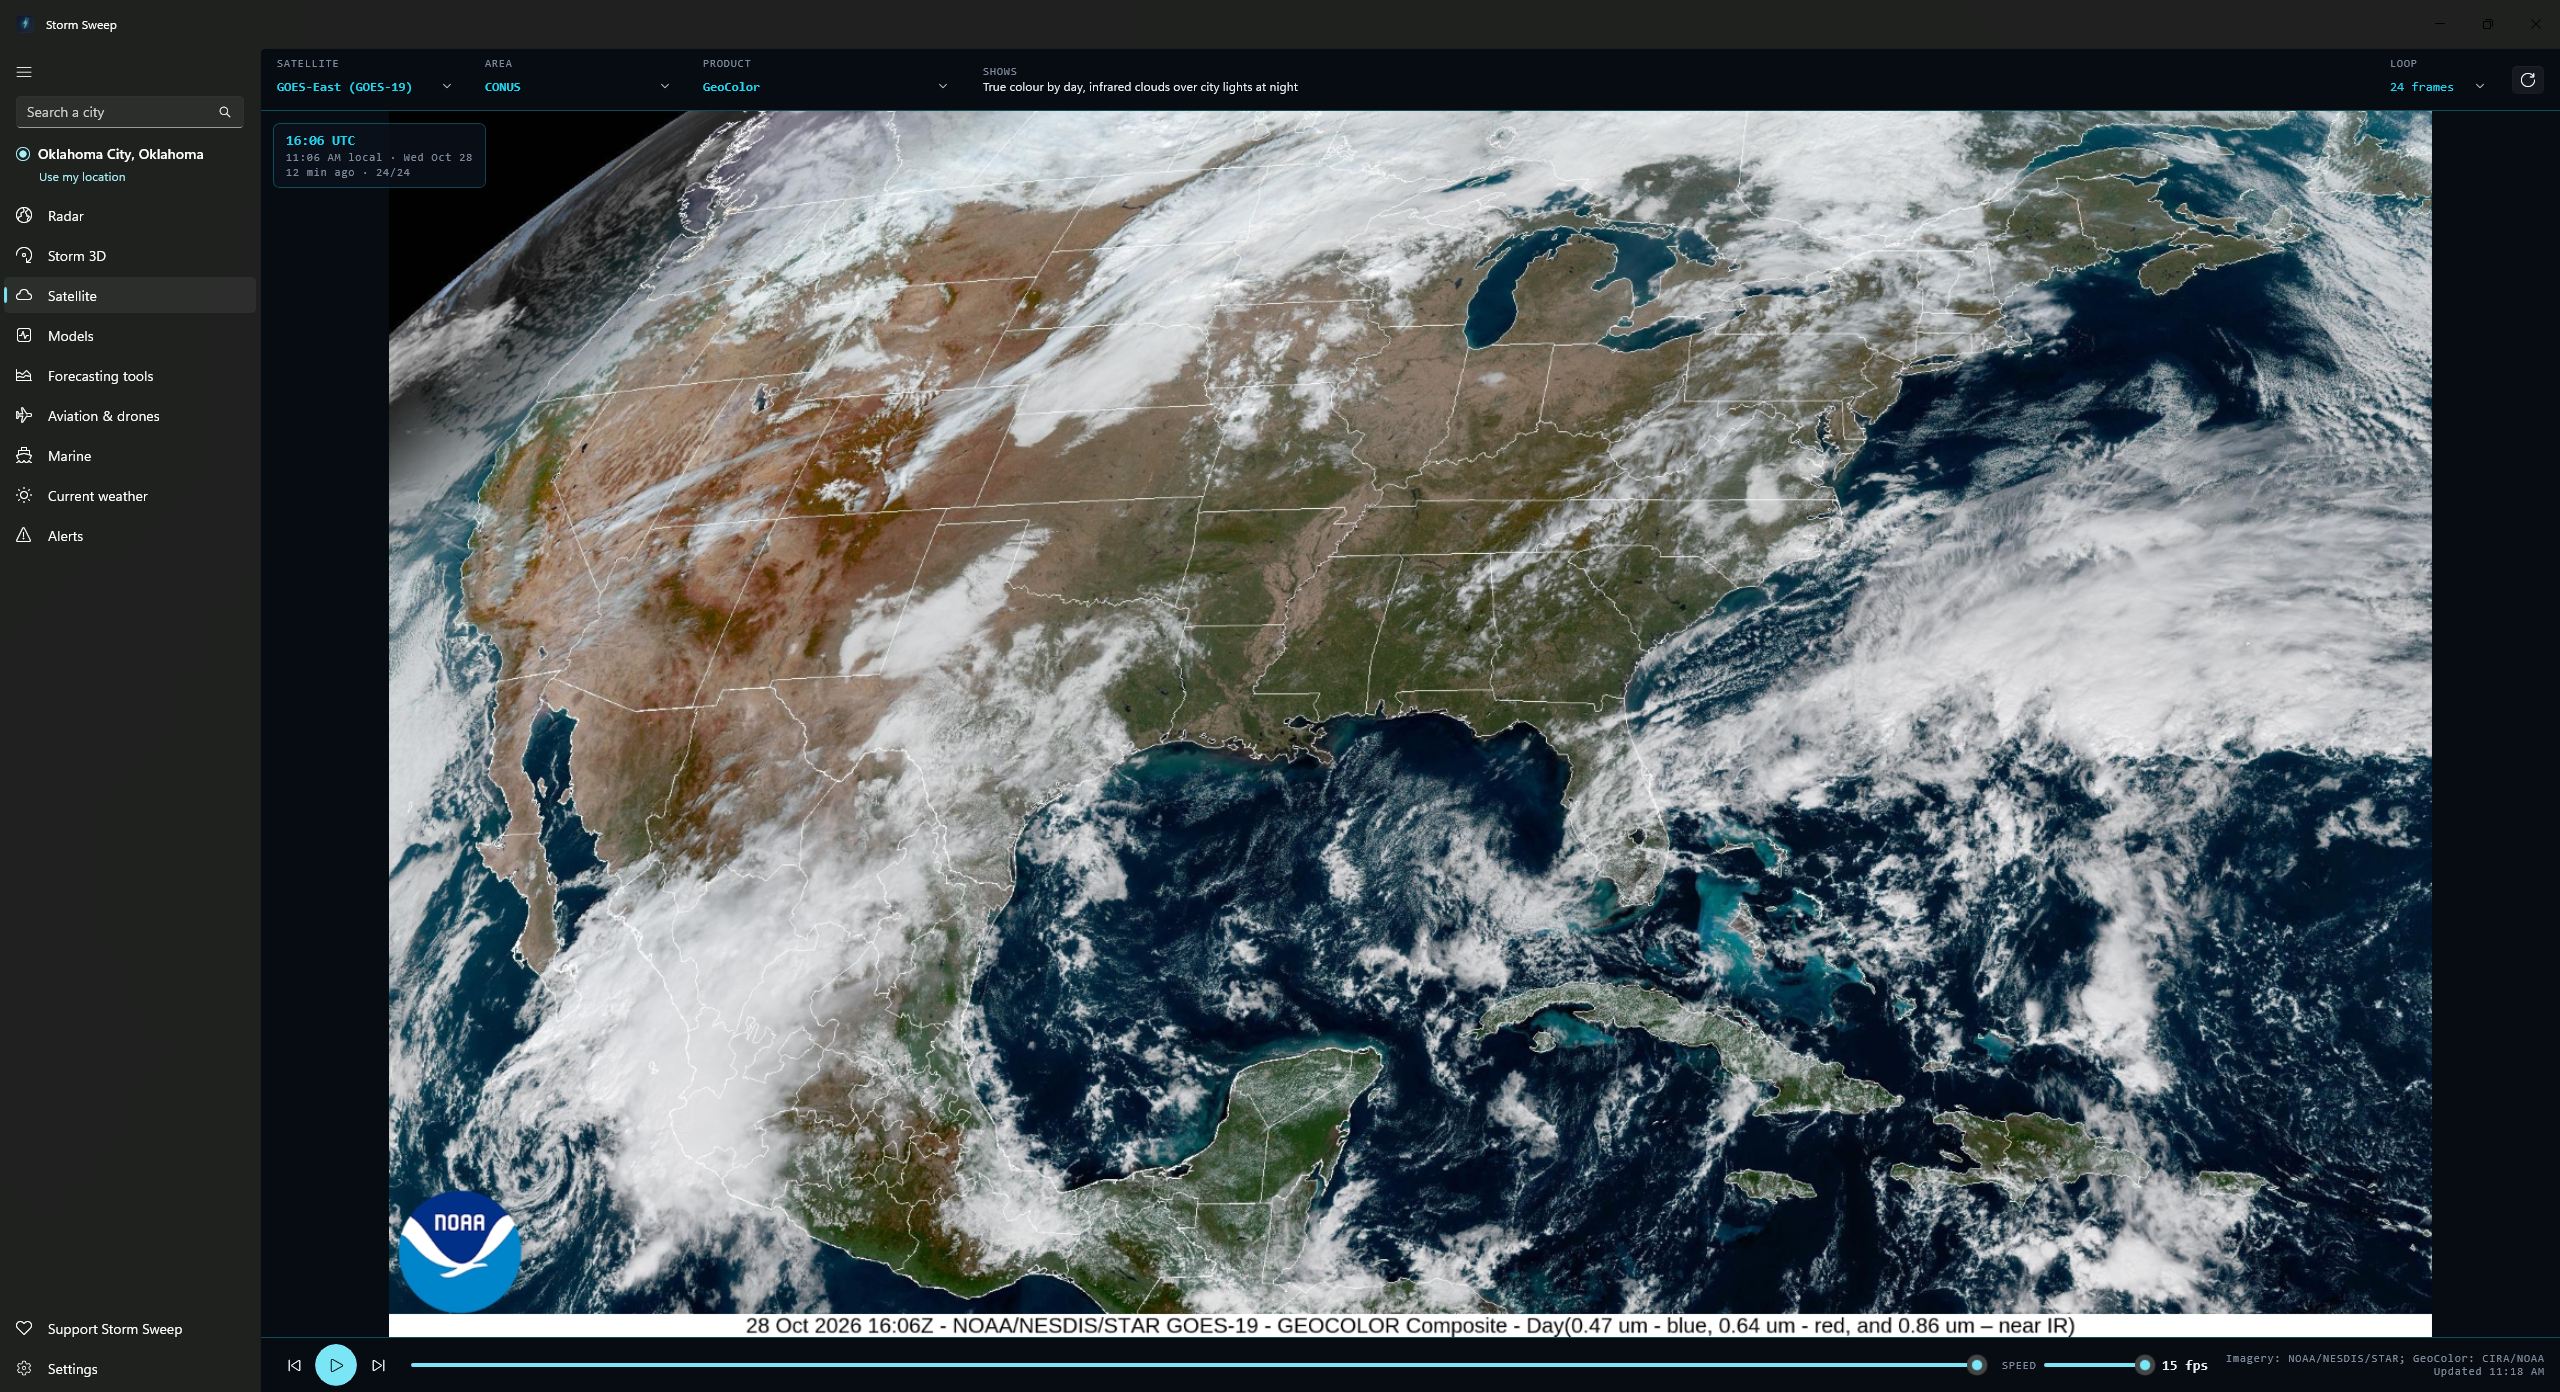
Up to 25 products, plainly described
GeoColor, all sixteen ABI bands, the RGB composites meteorologists actually use (Air Mass, Sandwich, the combined Day Cloud Phase / Night Microphysics among them) plus Derived Motion Winds. The picker lists the products NOAA STAR publishes for the area you have chosen, so smaller sectors offer fewer than the full set. Each one carries a plain description of what it shows, on screen beside the picker.
Zoom and pan the image
Scroll-wheel zoom up to ten times at the pointer, drag to pan, double-click to fit. The app asks STAR for a middle size rather than its largest (2500 pixels wide on CONUS, 1808 on the full disk), so a long loop fits in memory; where a product is published only at sizes far from that target, as Derived Motion Winds is, the smallest size above it is taken instead, which on CONUS is 5000 pixels wide. Longer loops are decoded smaller again.
Full disk, CONUS, mesoscale and regional
Switch between the full disk, the continental US, NOAA’s two mesoscale sectors and STAR’s regional sectors: 22 regions on GOES-East, 12 on GOES-West. Loop length is yours to set at 12, 24 or 48 frames, and a new ABI image arrives every minute on the mesoscale sectors, every five on CONUS and the regions, every ten on the full disk. Derived Motion Winds is the exception, published hourly whatever the area.
Loop controls and frame times
Play and pause, step a frame at a time, or drag the timeline. A speed slider runs from 1 to 15 frames per second, and the newest frame is held briefly before the loop wraps. The panel over the image gives the scan time of the frame you are looking at in UTC and in local time, its date, how old it is and its place in the loop. While the tab is on screen the app re-lists STAR every two minutes on the mesoscale sectors and every five elsewhere, picking up new scans on its own; off screen, playback and refresh stop.
Satellite is live only: the app loops the newest 12, 24 or 48 frames and nothing older, so there is no past-date replay here as there is on the radar tab, and no way to save a frame or export the loop. The images are NOAA STAR’s own finished JPEGs. Storm Sweep decodes and loops them rather than drawing the imagery itself, and draws nothing of its own onto the imagery, so the warning polygons, storm tracks and rulers from the radar tab are not available over satellite. The credit on screen reads NOAA/NESDIS/STAR, with GeoColor credited to CIRA/NOAA.
Four forecast models, decoded here
Storm Sweep reads raw GRIB2 straight from NOAA and ECMWF and draws the maps itself. No third-party model site in between.
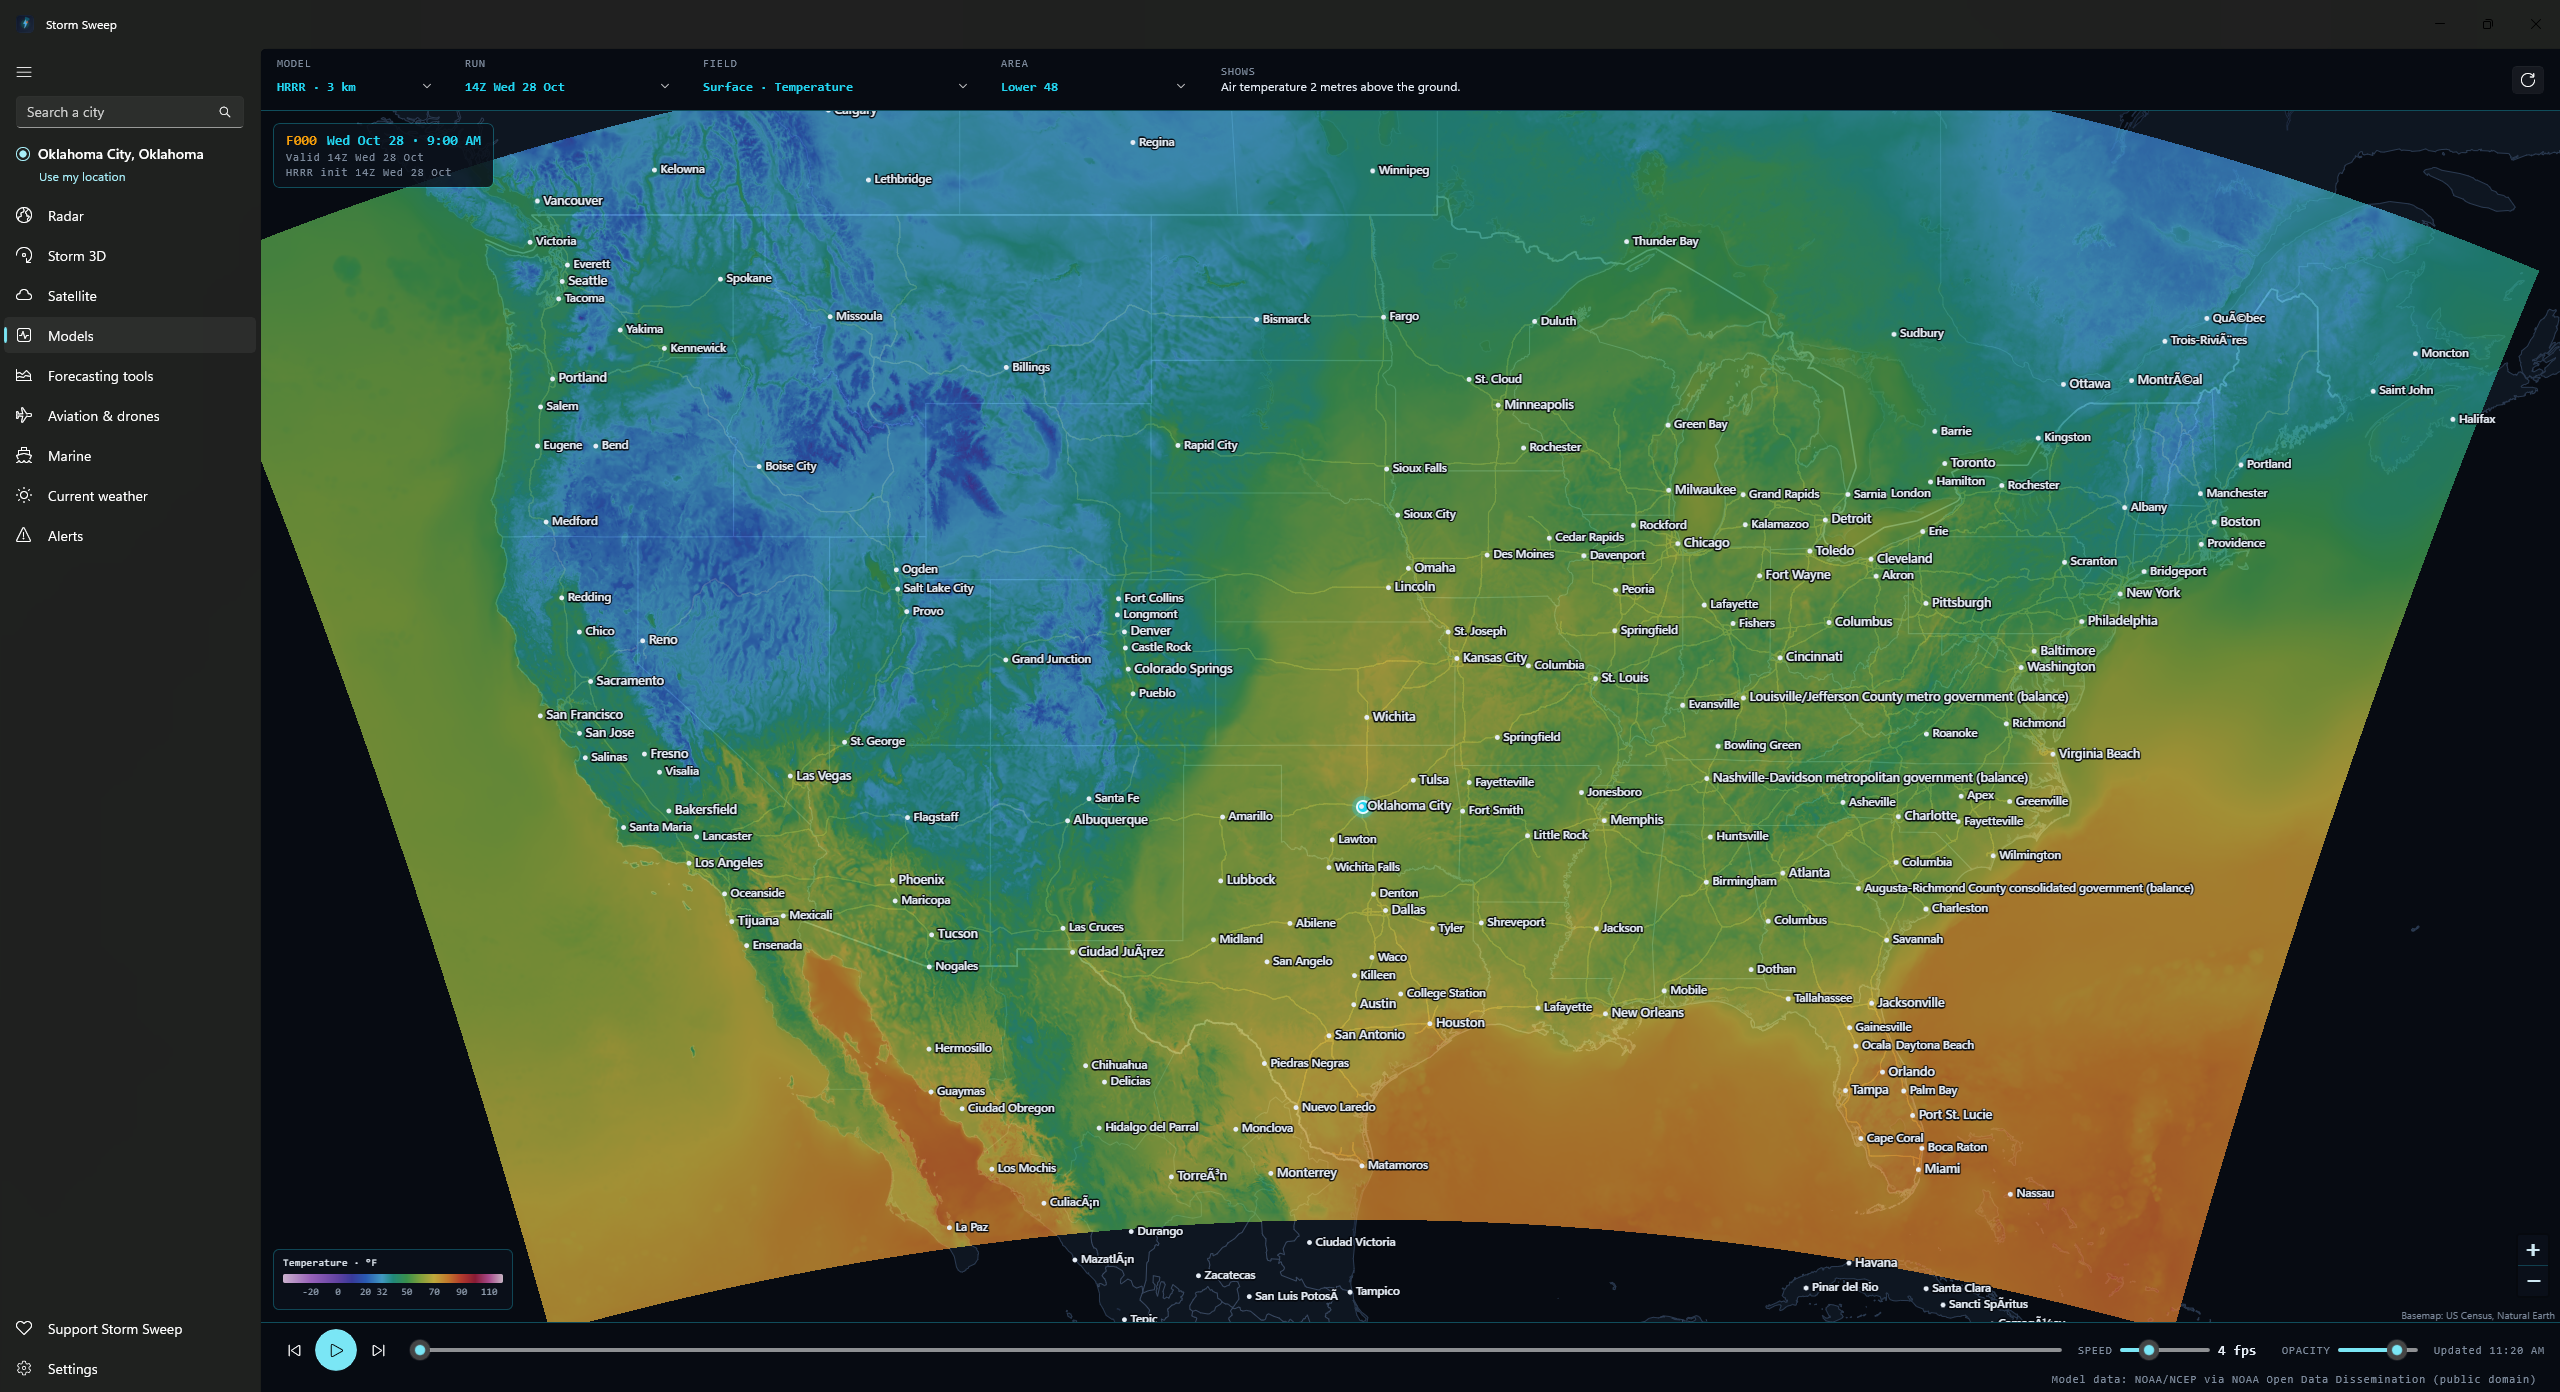
HRRR, RRFS, GFS and ECMWF IFS
HRRR and RRFS at 3 km, both updating hourly. RRFS is NOAA’s new rapid-refresh system, pre-operational until it takes over from the NAM and HREF on 3 November 2026, a date NOAA’s service change notice allows to slip. GFS at 0.25° and ECMWF IFS open data at 0.25°. How far a run reaches depends on its cycle: HRRR and RRFS go 18 hours ahead, and 48 and 84 respectively from the 00, 06, 12 and 18 UTC runs; GFS reaches 16 days; ECMWF is three-hourly to six days, with the 00 and 12 UTC runs six-hourly to ten.
Eighteen map fields, not all of them on every model
Simulated radar, CAPE, helicity, updraft helicity, significant tornado parameter (computed here from the model’s own fields), wind and gusts, temperature, dewpoint, precipitation and snowfall among them. No single model carries all eighteen: seventeen fields on HRRR and RRFS, fourteen on GFS, twelve on ECMWF, and the app offers only the fields a given model actually carries rather than faking the rest.
Its own GRIB2 reader, pulling only the bytes it needs
Written for this app: regular lat/lon, Mercator, north-pole polar stereographic and Lambert conformal grids, and every packing scheme these four models use. The one exception is JPEG 2000, which only the marine wave models need. That goes through the open-source CoreJ2K library, credited in the app. The app reads each run’s published index, works out which byte ranges hold the fields being drawn and merges adjacent ones, so a map pulls a few megabytes out of a 150 MB file instead of the whole thing.
The run as a loop, with the next hours already fetched
Play the whole run at one to twelve frames a second, step forward and back a frame at a time with the buttons or the arrow keys, play and pause with the space bar, or drag the slider to a forecast hour. The page opens on the newest run that has finished posting, or on the newest of all when none has; the picker offers the last several cycles and marks how far an incomplete one has got, and any hour that has not landed reads “Not posted yet” until it does. The hour on screen is fetched first and its neighbours next, so moving to a nearby hour usually has nothing left to download, and the shading opacity is yours to set.
Twelve map areas: the 3 km models only inside their own grids, the global ones only inside a window
Eleven fixed areas (the lower 48, eight regional crops, North America and Alaska) plus an “Around me” view centred on your chosen place, with a cursor readout and a legend on every field. HRRR and RRFS are read for the lower 48 only and draw nothing outside it; HRRR Alaska, a fifth model on the Models tab, covers the Alaska area. GFS and ECMWF also reach Hawaii and Puerto Rico, which have no area of their own and are seen through the North America view or “Around me”, but each global run is cut to a window from 10° to 75°N and 170°E (across the date line) to 40°W before anything is drawn, so nothing further afield can be mapped.
The detail: forecast hours, GRIB2 packing and map intervals
How far each run reaches
HRRR runs 18 hours ahead, and 48 from the 00, 06, 12 and 18 UTC cycles; RRFS 18, and 84 from the same four, stepping hourly to F048 and every three hours beyond it; GFS four times a day out to 16 days; ECMWF to 10 days from its 00 and 12 UTC runs and 6 days from 06 and 18 UTC.
Inside the GRIB2 reader
HRRR, RRFS and GFS pack their fields with complex packing and spatial differencing, and HRRR’s 10 m winds with simple packing.
ECMWF’s open data uses CCSDS adaptive entropy coding instead, decoded by Storm Sweep’s own reimplementation of the reference algorithm rather than a bundled native library.
Runs still arriving
A run still arriving is topped up as more hours land, rather than restarting the loop. RRFS keeps its pressure levels in a second file that can land after the main one, so its 850 and 500 mb fields can wait a little longer than the rest.
Isobars, centres and barbs
The line work is computed from the grid, not baked into the picture.
Sea-level pressure isobars every 4 mb, with the highs and lows labelled, over the precipitation that fell in the step before. Height contours every 30 m at 850 mb and every 60 m at 500 mb.
Wind barbs on the surface wind, 850 mb and 500 mb fields only, on a 50 km lattice thinned further as you zoom out.
ECMWF open data is 0.25° at three-hourly steps to six days, with the 00 and 12 UTC runs continuing six-hourly to ten days, not the full-resolution licensed feed paid sites use. It carries most-unstable CAPE but no simulated radar, surface-based CAPE, helicity or tornado parameter. Model output is guidance, not an official forecast. The Models map needs WebGL2.
Eight tools, one page
The products a forecaster actually opens, most of them redrawn here from the published official data, and every map Storm Sweep draws labelled as its own drawing rather than an official product.
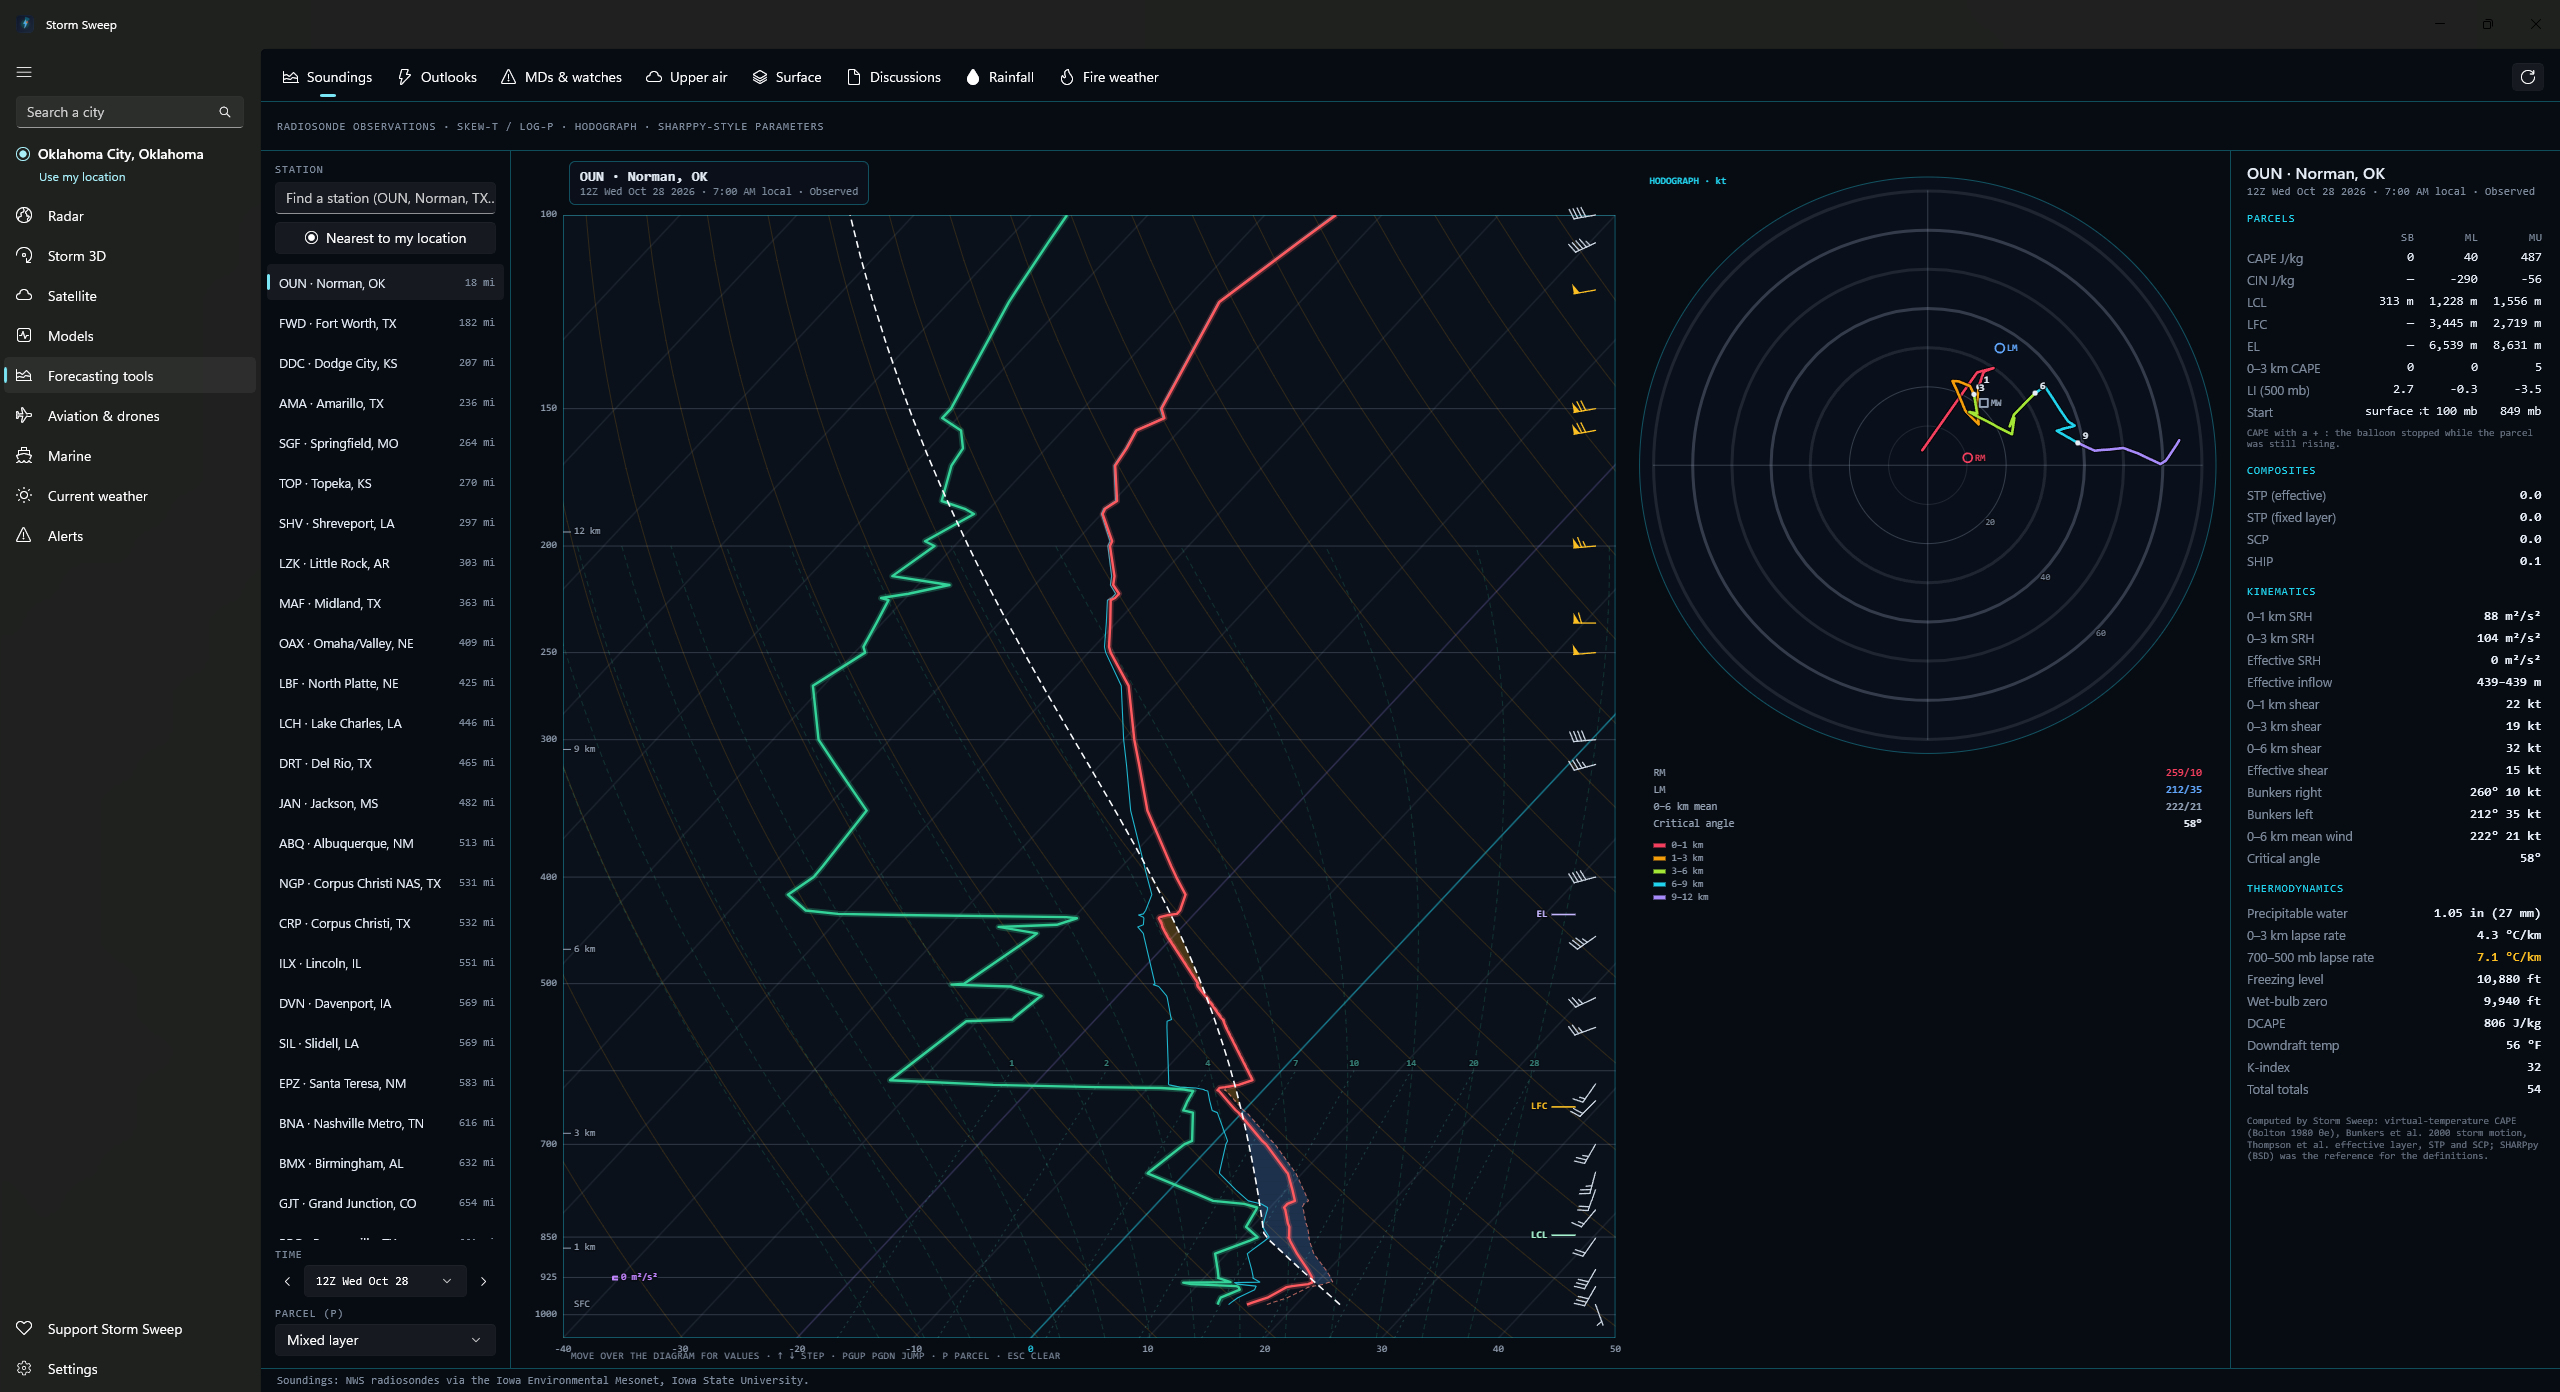
Observed soundings: Skew-T and hodograph
A full Skew-T log-P with hodograph and a parameter panel for any of 123 radiosonde sites across the US, Canada, Mexico, the Caribbean, Alaska and Hawaii, and for the newest 60 launches a site has listed, specials among them (about a month at a twice-daily site): CAPE, CIN, LCL, LFC and EL for the surface, mixed-layer and most-unstable parcels, plus shear, helicity, significant tornado and supercell composite. These are observed balloon soundings, and the panel says so. There are no model soundings. The maths comes from published literature, checked against an independent library.
An “Explain this chart” switch labels the parts of the diagram, the parameters carry plain-English names beside the technical ones, and a short tour runs the first time you open it.
SPC convective outlooks, Days 1 to 8
Categorical outlooks on Days 1 to 3, probabilistic on all eight days, with the conditional intensity groups SPC introduced in March 2026 in place of the hatched significant-severe areas, drawn for tornado, wind and hail on Days 1 and 2, and for any severe on Day 3.
Mesoscale discussions, watches and the Area Forecast Discussion
Current SPC mesoscale discussions, WPC mesoscale precipitation discussions, and tornado and severe thunderstorm watches: outlines on the map and the full text beside it, with a watch’s probability table when SPC has published one. The NWS office’s own reasoning, verbatim. The office covering your place is picked automatically, and you can switch to any other office that issues one, or step back through its recent issuances, up to the last 25.
Upper air and surface
850, 700, 500, 300 and 250 mb station plots with height contours and isotherms drawn by Storm Sweep’s own Barnes objective analysis of the plotted reports, labelled as such, not presented as an official analysis. Current North American airport observations as standard station models (temperature, dewpoint, wind barb, pressure, sky cover) with WPC fronts drawn over them.
Rainfall and fire weather
WPC excessive-rainfall outlooks for Days 1 to 5, and quantitative precipitation forecasts for Day 1, Day 2, Day 3, Days 4 to 5, Days 6 to 7 and the 3-day and 7-day totals. SPC fire-weather outlooks cover wind and humidity, and dry thunderstorms, on Days 1 and 2.
Click a point, read the outlook
On the outlook, rainfall and fire-weather maps, clicking anywhere reads out what the layer says at that spot: the risk category on the days SPC draws one, each hazard’s probability, the name of the excessive-rainfall or fire-weather area, or the forecast amount in your chosen precipitation unit on the precipitation layers. It says plainly when the point falls below the lowest contour or category rather than leaving the row blank, and where the click lands inside an intensity area the hazard row carries that area’s group. The outlook tool also opens SPC’s own written discussion beside the map: that day’s text for Days 1, 2 and 3, and the single Day 4 to 8 discussion beyond them.
It says when the data is old
Each tool refreshes on its own interval (four minutes for mesoscale discussions, ten for the outlooks, an hour for upper air) and only while you have it on screen. A refresh that fails leaves the last good data on the map with a banner saying how old it is, rather than blanking the view. If spc.noaa.gov stops answering, the convective outlooks come from NOAA’s map service instead; the note line says so unless it is already reporting nothing outlooked or an ended valid period.
The detail: isotach levels, cycle picker and expired discussions
Upper air: isotach levels and the cycle picker
At 300 and 250 mb the same analysis shades isotachs.
The cycle picker reaches back about a week of 00Z and 12Z cycles, and a cycle whose reports are not in yet says so instead of drawing a bare map.
Expired discussions stay on the list
A checkbox keeps the last six hours of expired discussions on the list, labelled as expired.
Six of the eight tools put the same line first in their own footer: drawn by Storm Sweep from the published data, not an official NWS product. The map drawings are Storm Sweep’s; the product texts these tools open (mesoscale and precipitation discussions, watch statements, SPC’s outlook discussion and the Area Forecast Discussions) are the NWS wording as issued. There is no mesoanalysis here: no gridded CAPE, shear or composite-parameter overlays. The outlook, surface, rainfall and fire-weather tools show only the current issuance. The maps and the Skew-T run inside the Microsoft Edge WebView2 Runtime.
Planning tools, never a verdict
Six tools built from free public data: US government weather and FAA products throughout, on a base map built from US Census Bureau and Natural Earth files. Official text is carried through verbatim, with the raw report beside the decoded view and each product’s issue, valid or download times. What Storm Sweep works out itself is labelled computed: TAF flight categories, runway wind components, pressure and density altitude, route ground speeds and times, twilight times, and ceiling and cloud base as heights above a model’s ground. The unit conversions behind every figure are Storm Sweep’s arithmetic too; its Terms name them among the values it calculates itself. It never tells you whether to fly.
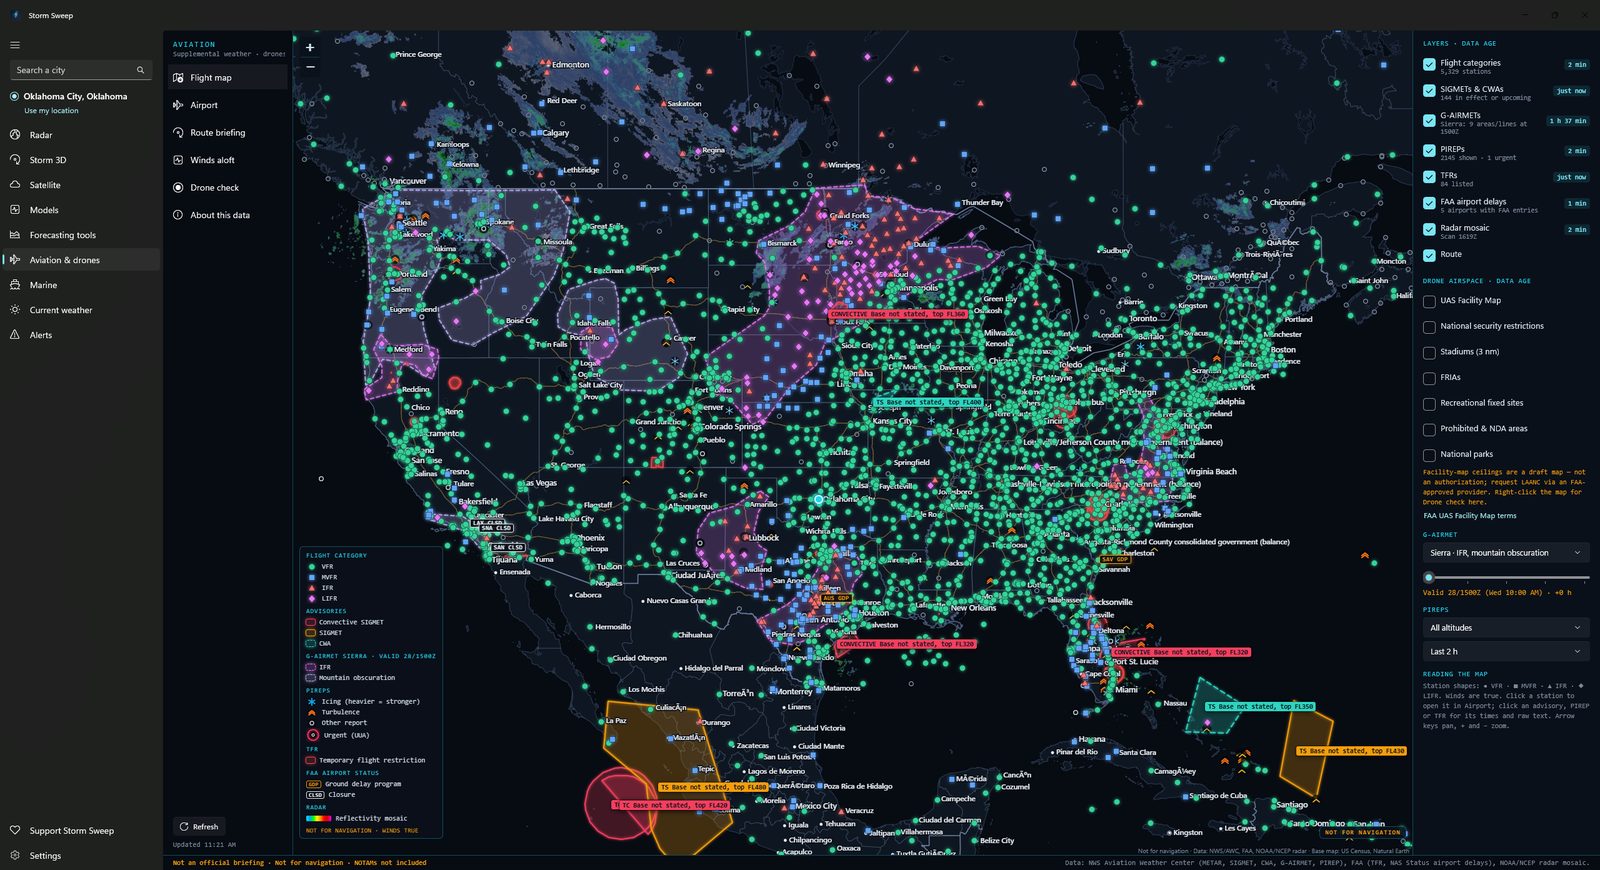
Flight map, FAA delays and winds aloft
Eight toggleable layers with their data ages: METARs shaped and coloured by flight category, PIREPs filtered by altitude and age, SIGMETs and CWAs, G-AIRMETs, temporary flight restrictions, FAA delays, radar and more. The G-AIRMET slider steps through that product’s own forecast snapshots, which are 3 hours apart; conditions between snapshots are not shown. An advisory in effect with no area to draw cannot be plotted at all: the layer note counts those, and the Airport and Route tools list the US ones with their text. Ground stops, ground delay programs, arrival and departure delays, closures and deicing from the FAA’s NAS Status feed, as badges and an airport card. Forecast winds and temperatures aloft, including Alaska, Hawaii and other Pacific regions.
Airport tool
Search a US airport by identifier or name: decoded METAR alongside the raw text, a six-hour trend strip, a colour-coded TAF timeline with every period decoded, runway headwind and crosswind components with gusts, pressure and density altitude, and frequencies. Ten cards in all.
The airport figures Storm Sweep computes
Each TAF period’s flight category is worked out by Storm Sweep from the conditions in force rather than read from the product. The wind components are computed on true runway headings. Pressure altitude is an estimate from the field elevation and the METAR’s altimeter setting, and density altitude adds the METAR temperature; neither is a performance figure. The app tags all three as computed.
Route briefing
Enter a departure, a destination and any airports in between, a cruise altitude, a departure time and a true airspeed. Storm Sweep gathers what the NWS and FAA have published for a 25 nm corridor along the route and assembles seven numbered sections in the order a standard briefing uses: adverse conditions, the forecaster’s synopsis, current conditions in that corridor, pilot reports from the last two hours in it within 4,000 ft of cruise, the destination TAF with the groups covering your ETA highlighted, winds aloft with leg timing, and a NOTAM section that links out to FAA NOTAM Search and Flight Service instead of carrying NOTAMs itself. Each leg’s headwind, ground speed, ETE and ETA are computed from the FB tables and labelled as computed, and where no FB table covers a leg, the briefing says so and times that leg at true airspeed with no wind at all. The footer lists product by product when each one was issued or fetched. It is supplemental, not an official briefing.
Drone check
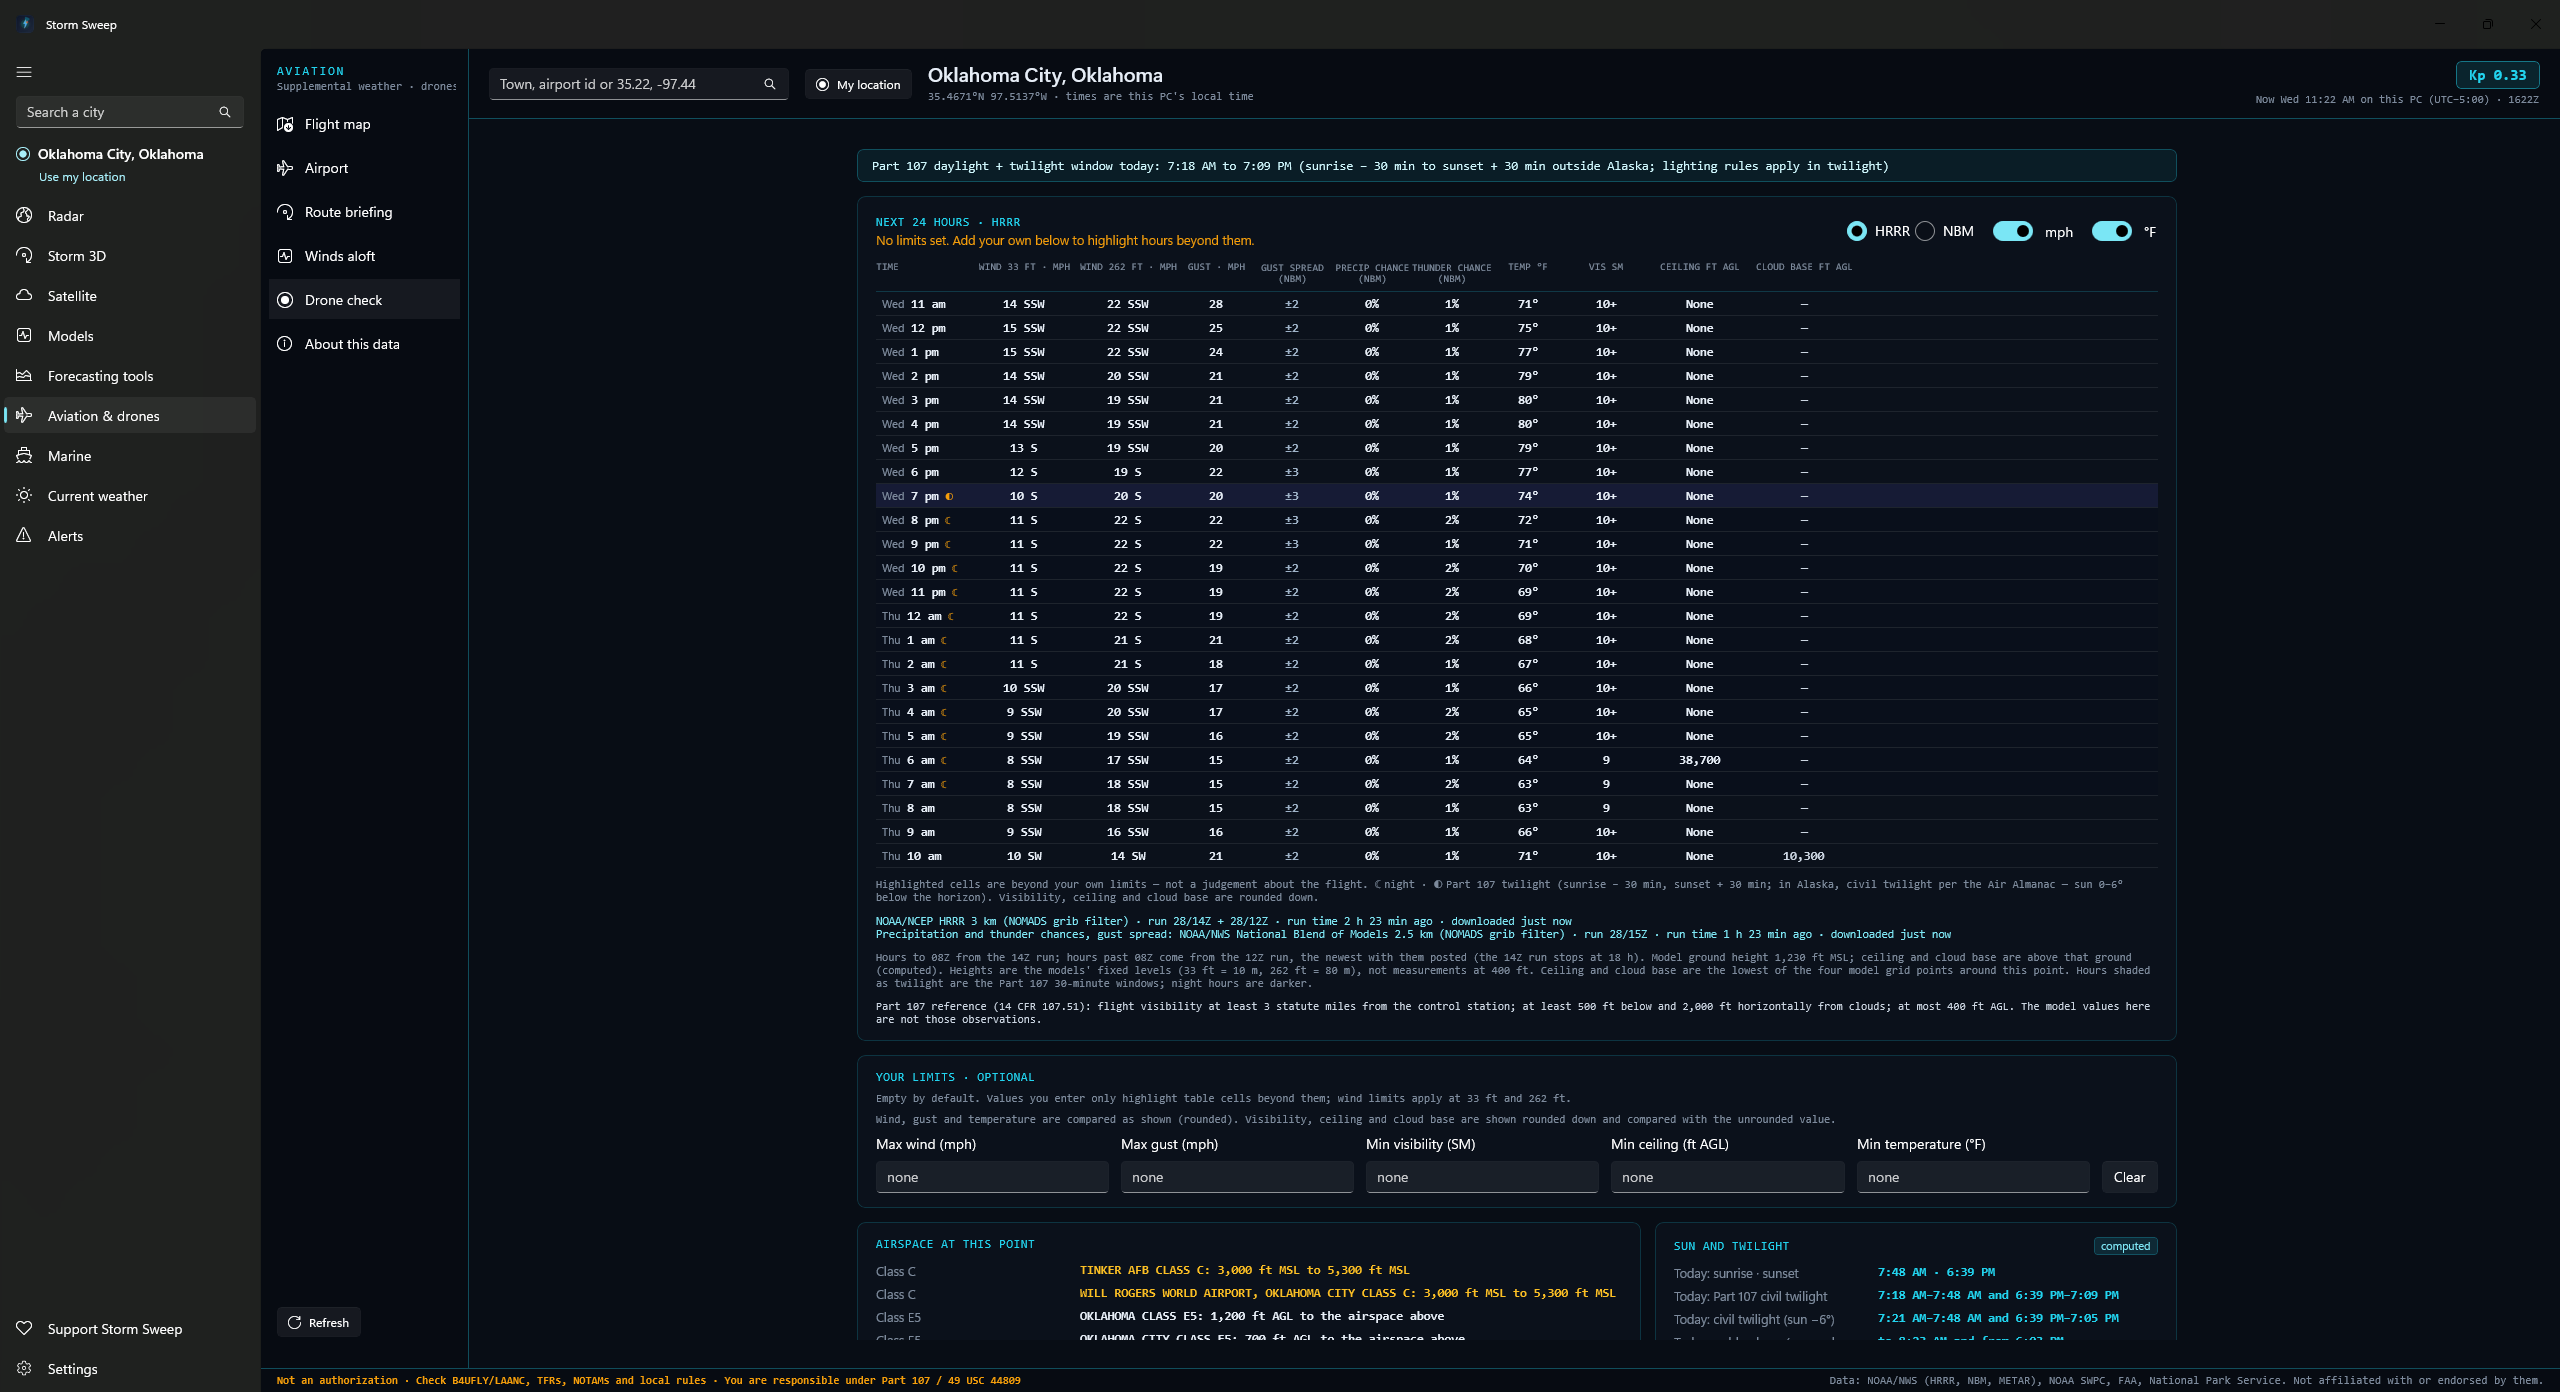
Twenty-four hours of wind at 33 and 262 feet, gust, temperature, visibility, ceiling and cloud base from HRRR or the National Blend of Models, with precipitation and thunder chances and the gust spread always taken from NBM. HRRR covers the lower 48 and Alaska hour by hour; the Blend adds Hawaii and Puerto Rico, though its Alaska grid gives a row every third hour and its Hawaii grid every second, with the hours between left blank and the card saying so. A point outside both gets a plain coverage sentence instead of a failure. Every hour is shaded day, Part 107 twilight or night, and a sun card lists sunrise and sunset, the Part 107 twilight window, civil twilight at sun −6° and golden hour for today and tomorrow, all computed for the point with the NOAA solar equations and labelled computed. The twilight window shown is the sunrise − 30 and sunset + 30 minute rule that applies outside Alaska; in Alaska the app points instead to the Air Almanac definition of civil twilight under 14 CFR 107.29 and gives the sun −6° times only as a reference. Up to three airport observations within 30 nautical miles of the point you check, nearest first, each decoded alongside its raw METAR and the age of the observation, labelled as observations at the airport, not at your point.
Your limits, your call
Set your own thresholds for wind, gust, visibility, ceiling and temperature. Exceeding hours are highlighted and counted. The app never says “safe”, “unsafe” or “clear to fly”. Those words appear nowhere in it.
Not an official source, and the page that says so
The section’s own disclosure page. A notice you acknowledge the first time Aviation opens, and again whenever its wording changes, says Storm Sweep is not an FAA-approved or official source of aviation weather and does not provide a weather briefing, and that NOTAMs are not included; declining leaves the section.
The detail: ceilings, airspace and source credits
Airport tool: the advisories and the forecast discussion
They include the SIGMETs, CWAs and G-AIRMETs whose areas cover the field, the US advisories with no area to test against, flagged as not drawn rather than dropped, and the aviation section of the Area Forecast Discussion from the NWS office covering the airport, verbatim and attributed to that office.
FAA delays: counted, but not drawn
Airspace flow programs are counted but deliberately not drawn, since they are not airport-specific.
Drone check: the Kp chart
A Kp chart covers the last day and the next three, with the NOAA G-scale now and for the days ahead.
FAA UAS Facility Map ceilings, and what lies nearby
Grid-cell ceilings with the airport, its class and the FAA effective date, class airspace floors and ceilings at the point, and what lies nearby in the FAA’s and the Park Service’s own layers: prohibited areas and National Defense Airspace areas within ten nautical miles; National Security UAS flight restrictions, special use airspace, FAA-Recognized Identification Areas, recreational flyer fixed sites and National Park Service land within five; stadiums within three; and temporary flight restrictions with a published area within fifteen.
Honest negatives when a source fails
Each airspace layer, model and feed on the Drone check loads on its own. A negative (no Class B, C, D or E area listed at the point, “No grid”, nothing found nearby) is only said about a source that answered; one that failed is named with its reason as “Couldn’t be checked”, and for the airspace class and the facility-map cell it points you to B4UFLY or a LAANC provider instead.
Every downloaded source shows its own age, and the Kp, TFR and METAR lines are marked stale when the latest refresh failed, so a source that went quiet is never shown to you as a clear result.
Behind the Aviation notice: the About this data table
Behind it, a table gives every product its source agency, how often Storm Sweep re-reads it and its limits, alongside the attributions and links out to Flight Service, FAA NOTAM Search, aviationweather.gov and tfr.faa.gov.
US only. Storm Sweep is not an FAA-approved or official source of aviation weather and does not provide a weather briefing. The app makes you acknowledge that the first time you open the Aviation tab, before it loads anything, and a one-line reminder sits under every tool. Always obtain a complete preflight briefing from an approved source, such as Flight Service (1-800-WX-BRIEF) or aviationweather.gov, and check current NOTAMs and TFRs before every flight. NOTAMs are not included here, and there is no live flight tracking.
No local, state, park or property-owner rules are shown. There is no national dataset of them, and the Drone check says so under its nearby list. National Park Service outlines are simplified to about 200 metres and are not legal documents; near an edge the card marks the outline as simplified rather than giving a plain inside or outside. The FAA UAS Facility Map is a draft map whose altitudes are pre-approved maximums for an authorization request, not permission to fly. The Drone check is planning information, not an authorization: before every flight, check B4UFLY or an FAA-approved LAANC provider, current TFRs and NOTAMs, and local laws, and obtain any authorization you need. The app asks you to acknowledge that the first time the Drone check opens, and keeps a one-line reminder of it under the tool. Drone visibility and cloud base come from a model grid cell, not from your control station, which is what Part 107 requires you to judge. Not for navigation. Storm Sweep is not affiliated with or endorsed by the FAA, NOAA or the National Weather Service, and the pilot in command remains solely responsible for meeting 14 CFR 91.103 and for the safety of the flight.
Seven tools for US waters
Zone forecasts, buoys, tides, river gauges and wave guidance, with the official text carried through verbatim.
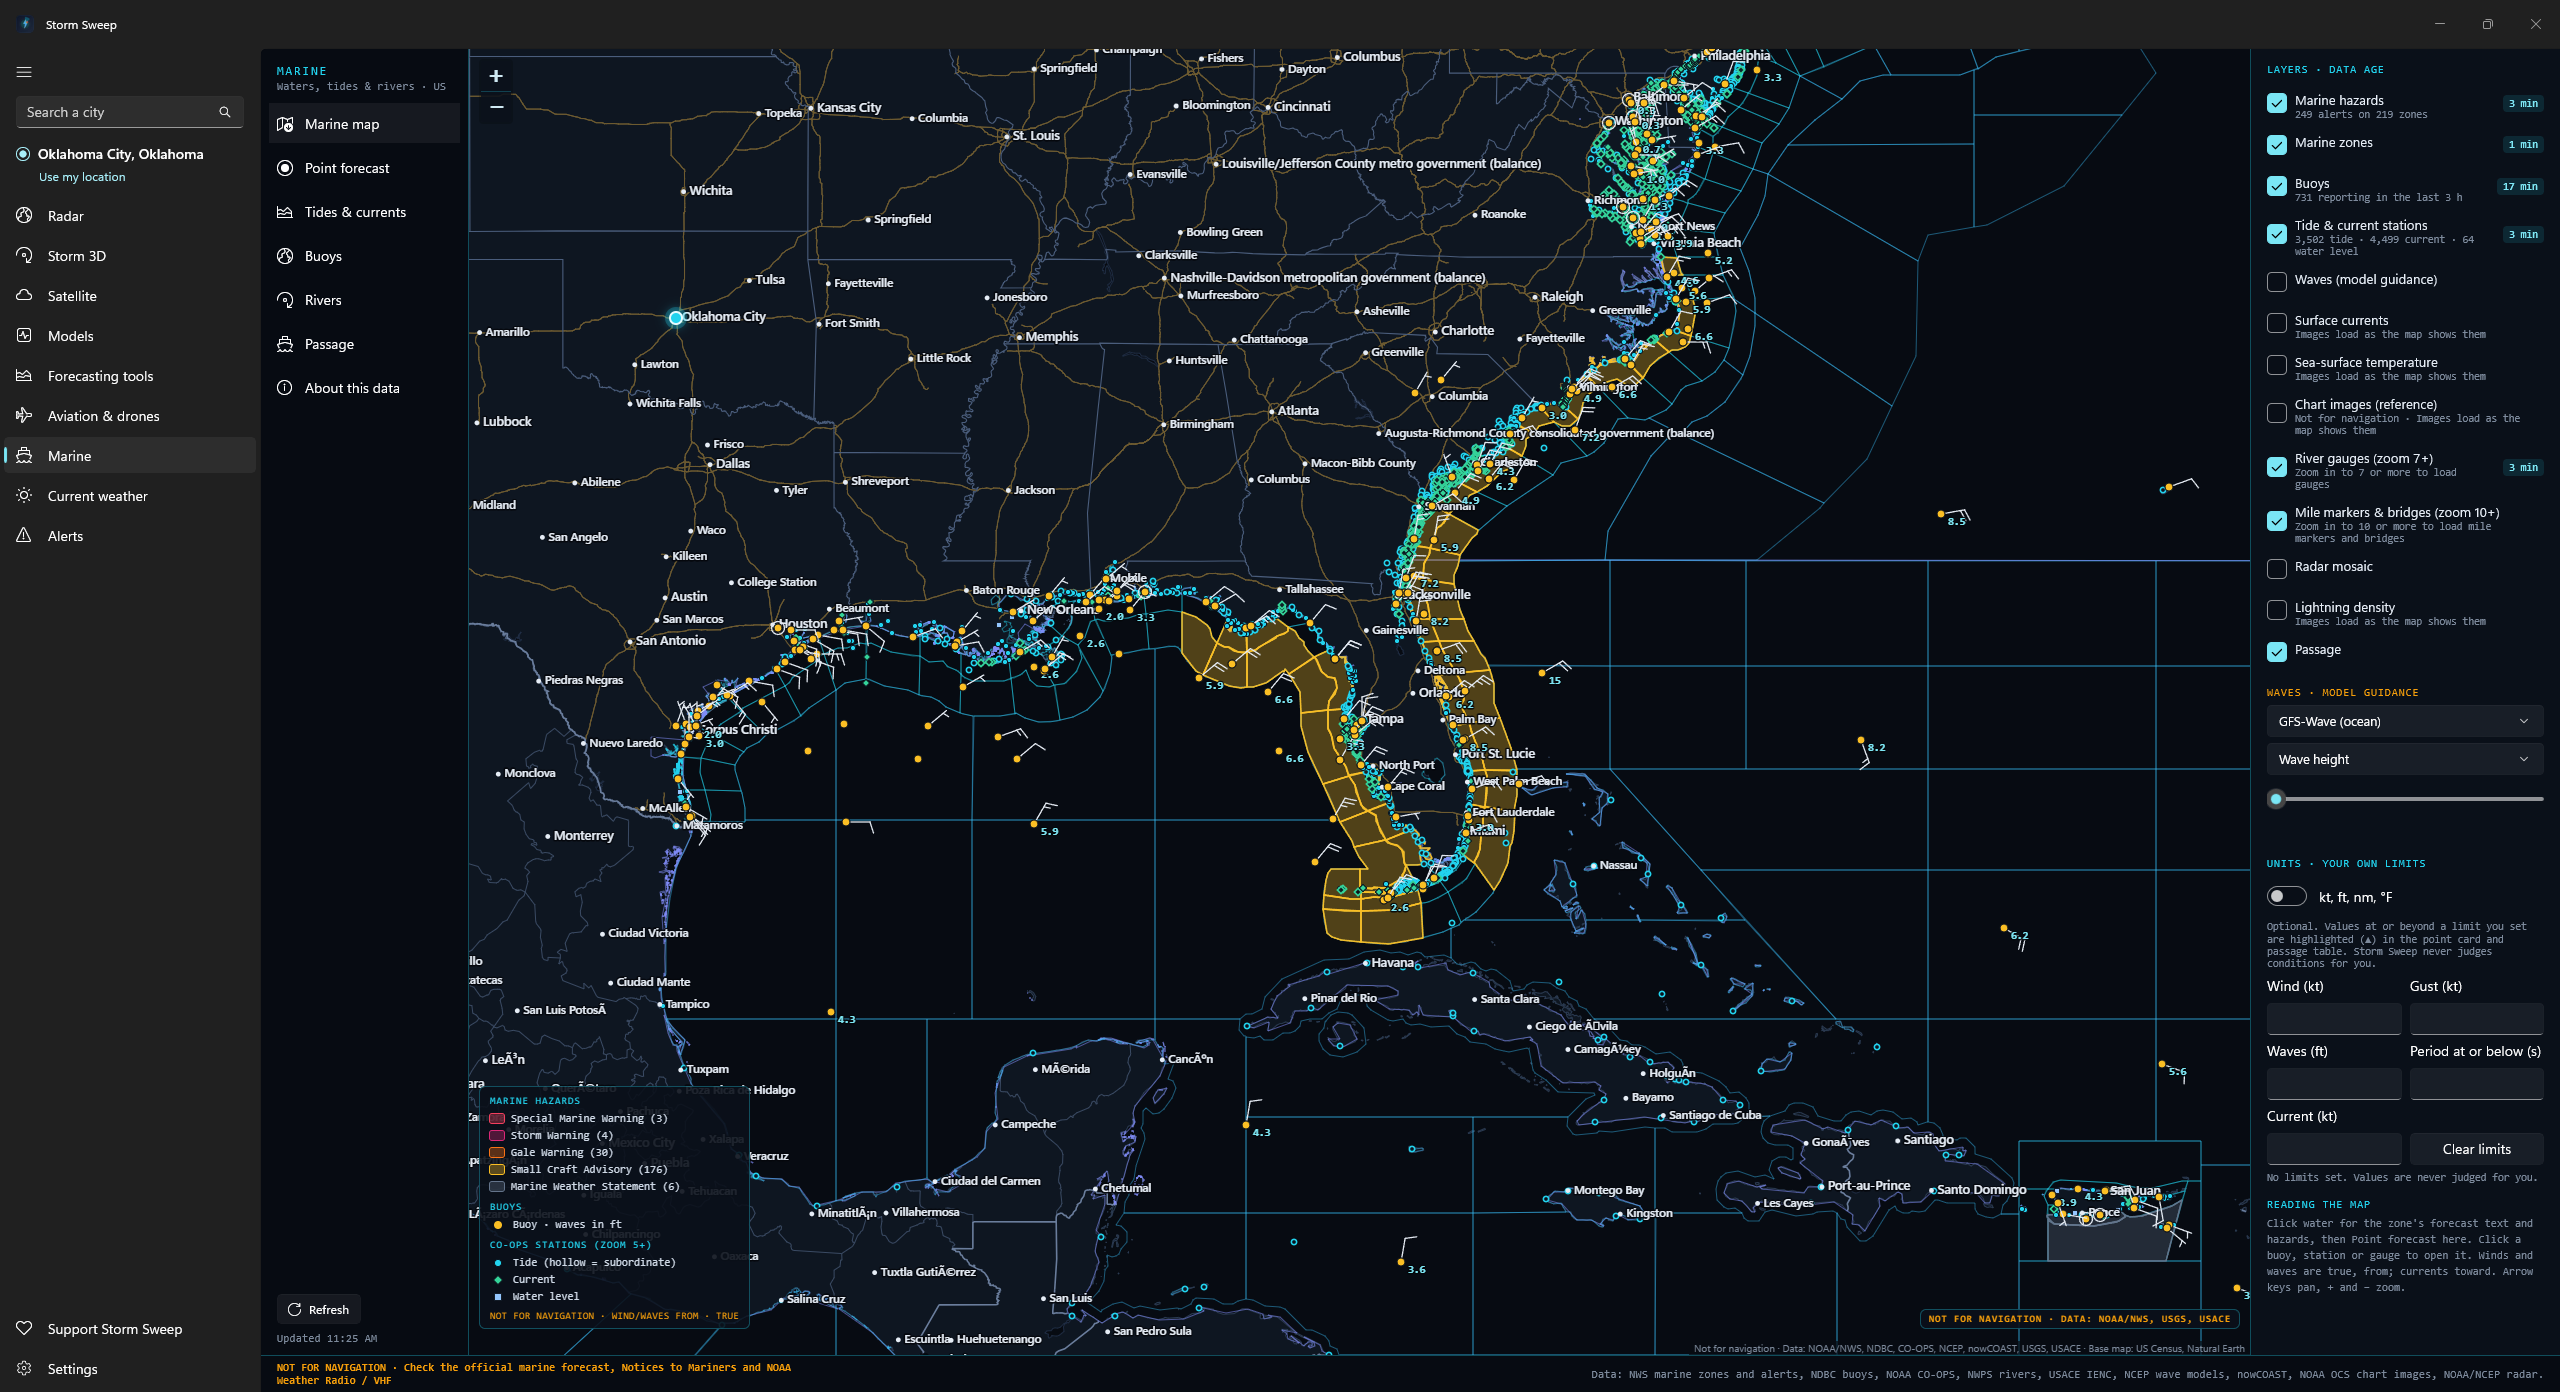
The map and the models
Thirteen toggleable layers over US waters, each with a data-age badge once that layer has loaded: hazards, 704 bundled marine zones, NDBC buoys, tide and current stations from zoom 5, river gauges from zoom 7, a wave model field, surface currents, sea-surface temperature, lightning strike density, NOAA chart images, the radar mosaic, USACE mile markers and bridges from zoom 10, and your last passage. Those three draw nothing until you have zoomed in that far, and the river gauge and mile-marker switches carry the zoom in their own names. GFS-Wave on west-coast, Atlantic, east-Pacific and global grids, the Great Lakes model and NWPS by forecast office are decoded from GRIB2 in the app. The currents, sea-surface temperature and lightning layers are NOAA nowCOAST rendered images, and RTOFS is decoded from GRIB2 for a point’s water temperature and current rather than for the map.
Click any water
Click any water and get the zone, its active headlines, the forecast text verbatim and the product’s issue time, then a point card built block by block: the NWS NDFD grid strip every three hours out to 48 hours where NWS publishes a grid, which is coastal waters, and beyond them the wave model stands in; wave model guidance and, where the RTOFS regional grids reach and outside the Great Lakes, near-surface water temperature and current, both marked in amber as guidance; the nearest reporting buoy within 60 nm with its distance and observation age; the nearest tide station within 30 nm and current station within 20 nm with their distances and next events; and sunrise, sunset, the twilights and the moon computed in the app. Each block loads on its own, and the grid, wave, buoy, tide and current blocks stay in place and say in plain words when nothing is in range, nothing is published or a source failed, rather than leaving a gap; the RTOFS water temperature and current block is simply absent outside that coverage rather than saying so. On an ocean beach zone it adds NWPS rip current probability, captioned as model guidance and pointing you to the NWS Surf Zone Forecast for the official risk.
Tides and currents
NOAA CO-OPS tide, current and water-level stations. A tide station draws a three-day predicted curve from the station’s own local midnight, with the day’s observed water level over it where the station has a sensor, the difference between observed and predicted, and a highs-and-lows table. Observed levels carry the quality flag CO-OPS gives them: preliminary, meaning not yet quality controlled, or verified. At a subordinate station CO-OPS publishes only the highs and lows, so Storm Sweep draws the curve between them, dashes it on the chart and labels it an estimate in amber rather than passing it off as a published prediction.
Buoys
Search NDBC buoys and C-MAN stations, or list the ones near your last point: the latest observation with its age (wind and gust, significant wave height with dominant and average period, swell and wind-wave components, pressure with its tendency, air and water temperature), each row only where that buoy transmits the field, and the swell and wind-wave split only where NDBC publishes it. NDBC real-time data are provisional. Then five days of wind, waves, period, pressure and temperature as charts. A buoy that has been recovered for the winter says it is not reporting rather than showing nothing.
River gauges
NWS gauges from the National Water Prediction Service: the hydrograph with flood-category bands and the forecast’s issue time, the action, minor, moderate and major stages, the low-water threshold with its navigation impacts quoted as published, historic crests, and the gauges upstream and downstream, each only where NWPS publishes it for that gauge. Many gauges are observed-only, with no forecast, no low-water threshold and no published impacts. River observations may be provisional.
Passage
Type a position (34.0, −77.6) or the name of a place with a CO-OPS tide station, or pick a start, any via points and an end on the map; give a speed in knots and a departure time, and the app lays great-circle legs between those points and samples along them: a timeline of ETA, distance along, zone, wind, gust, waves, period and visibility, every row naming its source: an NWS NDFD grid, wave model guidance in amber, or “no coverage”. A timeline only: no routing and no advice, up to 2,000 nm at 0.5 to 60 kt. The ETAs assume one constant speed through the water, and straight lines may cross land or shoals, so check official charts and Notices to Mariners.
Your limits, your call
Set your own figures for wind, gust, wave height and current, plus a wave period to flag at or below. Values that reach one get a ▲ beside them in the point card and the passage timeline, a highlight only, not advice. Storm Sweep never judges conditions for you, and no go/no-go verdict appears anywhere in the tab.
The detail: waypoints, station sensors, river credits, units and times
Passage, waypoint by waypoint
A passage also lists the zones crossed with their alerts and the tide and current stations near each waypoint with the events around its ETA.
Station detail: currents and sensors
Current stations get three days of predicted floods, ebbs and slacks with the next slack and the next maximum, and tide and water-level stations with sensors add their own water and air temperature, wind and pressure.
River gauges: credits, site ids and lock status
Observations are credited to USGS and the Corps of Engineers as published with the gauge, and the gauge’s USGS site id is shown.
Lock status is not published openly, so the tool links out to the Corps of Engineers instead of guessing.
Units and times
One switch moves every Marine tool between knots, feet, nautical miles and °F and metric units, and every time is shown in the zone at the point, with observation and issue times giving Zulu alongside.
Not for navigation: the whole tab, not just parts of it. The first time you open Marine the app puts the full notice in front of you and goes no further until you acknowledge it; decline and it returns you to the radar. Every tool then carries the line in its footer. Storm Sweep Marine does not replace official nautical charts, Notices to Mariners, or NOAA Weather Radio and VHF broadcasts: check the official marine forecast and warnings before departing, and keep a VHF radio aboard. US waters only. Forecasts, warnings and observations may be delayed, incomplete or preliminary, and model output is not an official forecast. Zone outlines are bundled and simplified for lookup and drawing. NOAA chart images are a reference display NOAA itself states is not suitable for navigation and does not meet Coast Guard carriage requirements. Storm Sweep is not affiliated with or endorsed by NOAA, the National Weather Service, the U.S. Coast Guard, USGS or USACE. Marine → About this data repeats the notice word for word, with a row for each product giving its source, how often it changes and its limits, plus links out to the USCG Local Notices to Mariners and Light List, NOAA charts and the NWS marine forecasts.
Today’s weather on one moving map
The Current weather tab is a moving map of your area or the whole country. It opens on wind, with warnings and hurricanes on, and your layers, opacity settings and wind sliders are saved on this PC, and pins and your last view are kept only if you turn on “Keep pins” and “Open on my last view”.
Twenty-three layers
Everyday: wind, temperature, radar, dew point, humidity, gusts, precipitation, pressure lines and isobars. Severe: CAPE, wind shear, helicity, a tornado index, fronts, and warnings and watches. Aviation & drones: wind at 10 and 80 m. Outdoor: soil temperature, wet bulb globe temperature and UV index, both labelled estimates. Marine: sea surface temperature and waves. Tropical: hurricanes. A docked panel lists “On the map” and “All layers”, with opacity, Solo, Remove and a Pin for each.
Wind streaks you can tune
Streaks drawn from the model’s wind, with Density and Speed sliders from 25% to 200%. One shaded layer shows at a time, so the streaks stay readable on top.
A time bar with a past and a future
Step by the hour from three hours back to twelve hours ahead. Every hour is tagged Observed, Analysis or Forecast: observed hours show NOAA radar, analysis hours show the model’s own hour zero. Play, step, go back to Now, or change speed. Observed radar frames are 5 minutes apart on Local and 15 on Nationwide.
A readout from the nearest station
At Now and in the past, the readout comes from the nearest NWS station’s latest observation: temperature, wind, dew point, pressure, sky, feels like, humidity, precipitation and the station itself. After Now it switches to the NWS hourly forecast, which covers temperature, wind and chance of precipitation only. Hover the map to read the layers that are on.
Pins and a ruler
Up to five pins, each with a 12-hour mini forecast of temperature, wind and gusts, and precipitation, and a ruler (press M) to measure distance. “Keep pins” saves them.
HRRR where it reaches, GFS everywhere else
The map uses HRRR over the lower 48 and GFS beyond it (for an Alaska place, HRRR Alaska is offered once you agree to its download), with a “Regional Model: GFS (Lower Resolution)” badge when the lower-resolution model is drawing the view. Wind shear, the tornado index and wind at 80 m exist only on HRRR; soil temperature, sea surface temperature and waves come from GFS everywhere.
Warnings and hurricanes
Severe and Extreme NWS alerts that have a drawn area appear on the map (for an Alaska place, every severity, with zone-only alerts drawn on their zones), and clicking one opens the Weather Service’s full text with its areas, onset and end. NHC tropical storms are drawn as tracks and cones whenever one is active.
UV index and wet bulb globe temperature are clear-sky estimates worked out on your PC. Observed radar hours are NOAA pictures, so they carry no dBZ value, and after Now the readout is a forecast only for the rows that say so. The map never says whether conditions are safe or unsafe. US only for weather; outside the lower 48 the model is GFS (HRRR Alaska is offered for Alaska). Storm Sweep is not an official warning system.
Warnings on your desktop
Official National Weather Service alerts, with notifications that, where Windows allows it, keep watching after you close the window, and the full text of every alert on your own desktop.
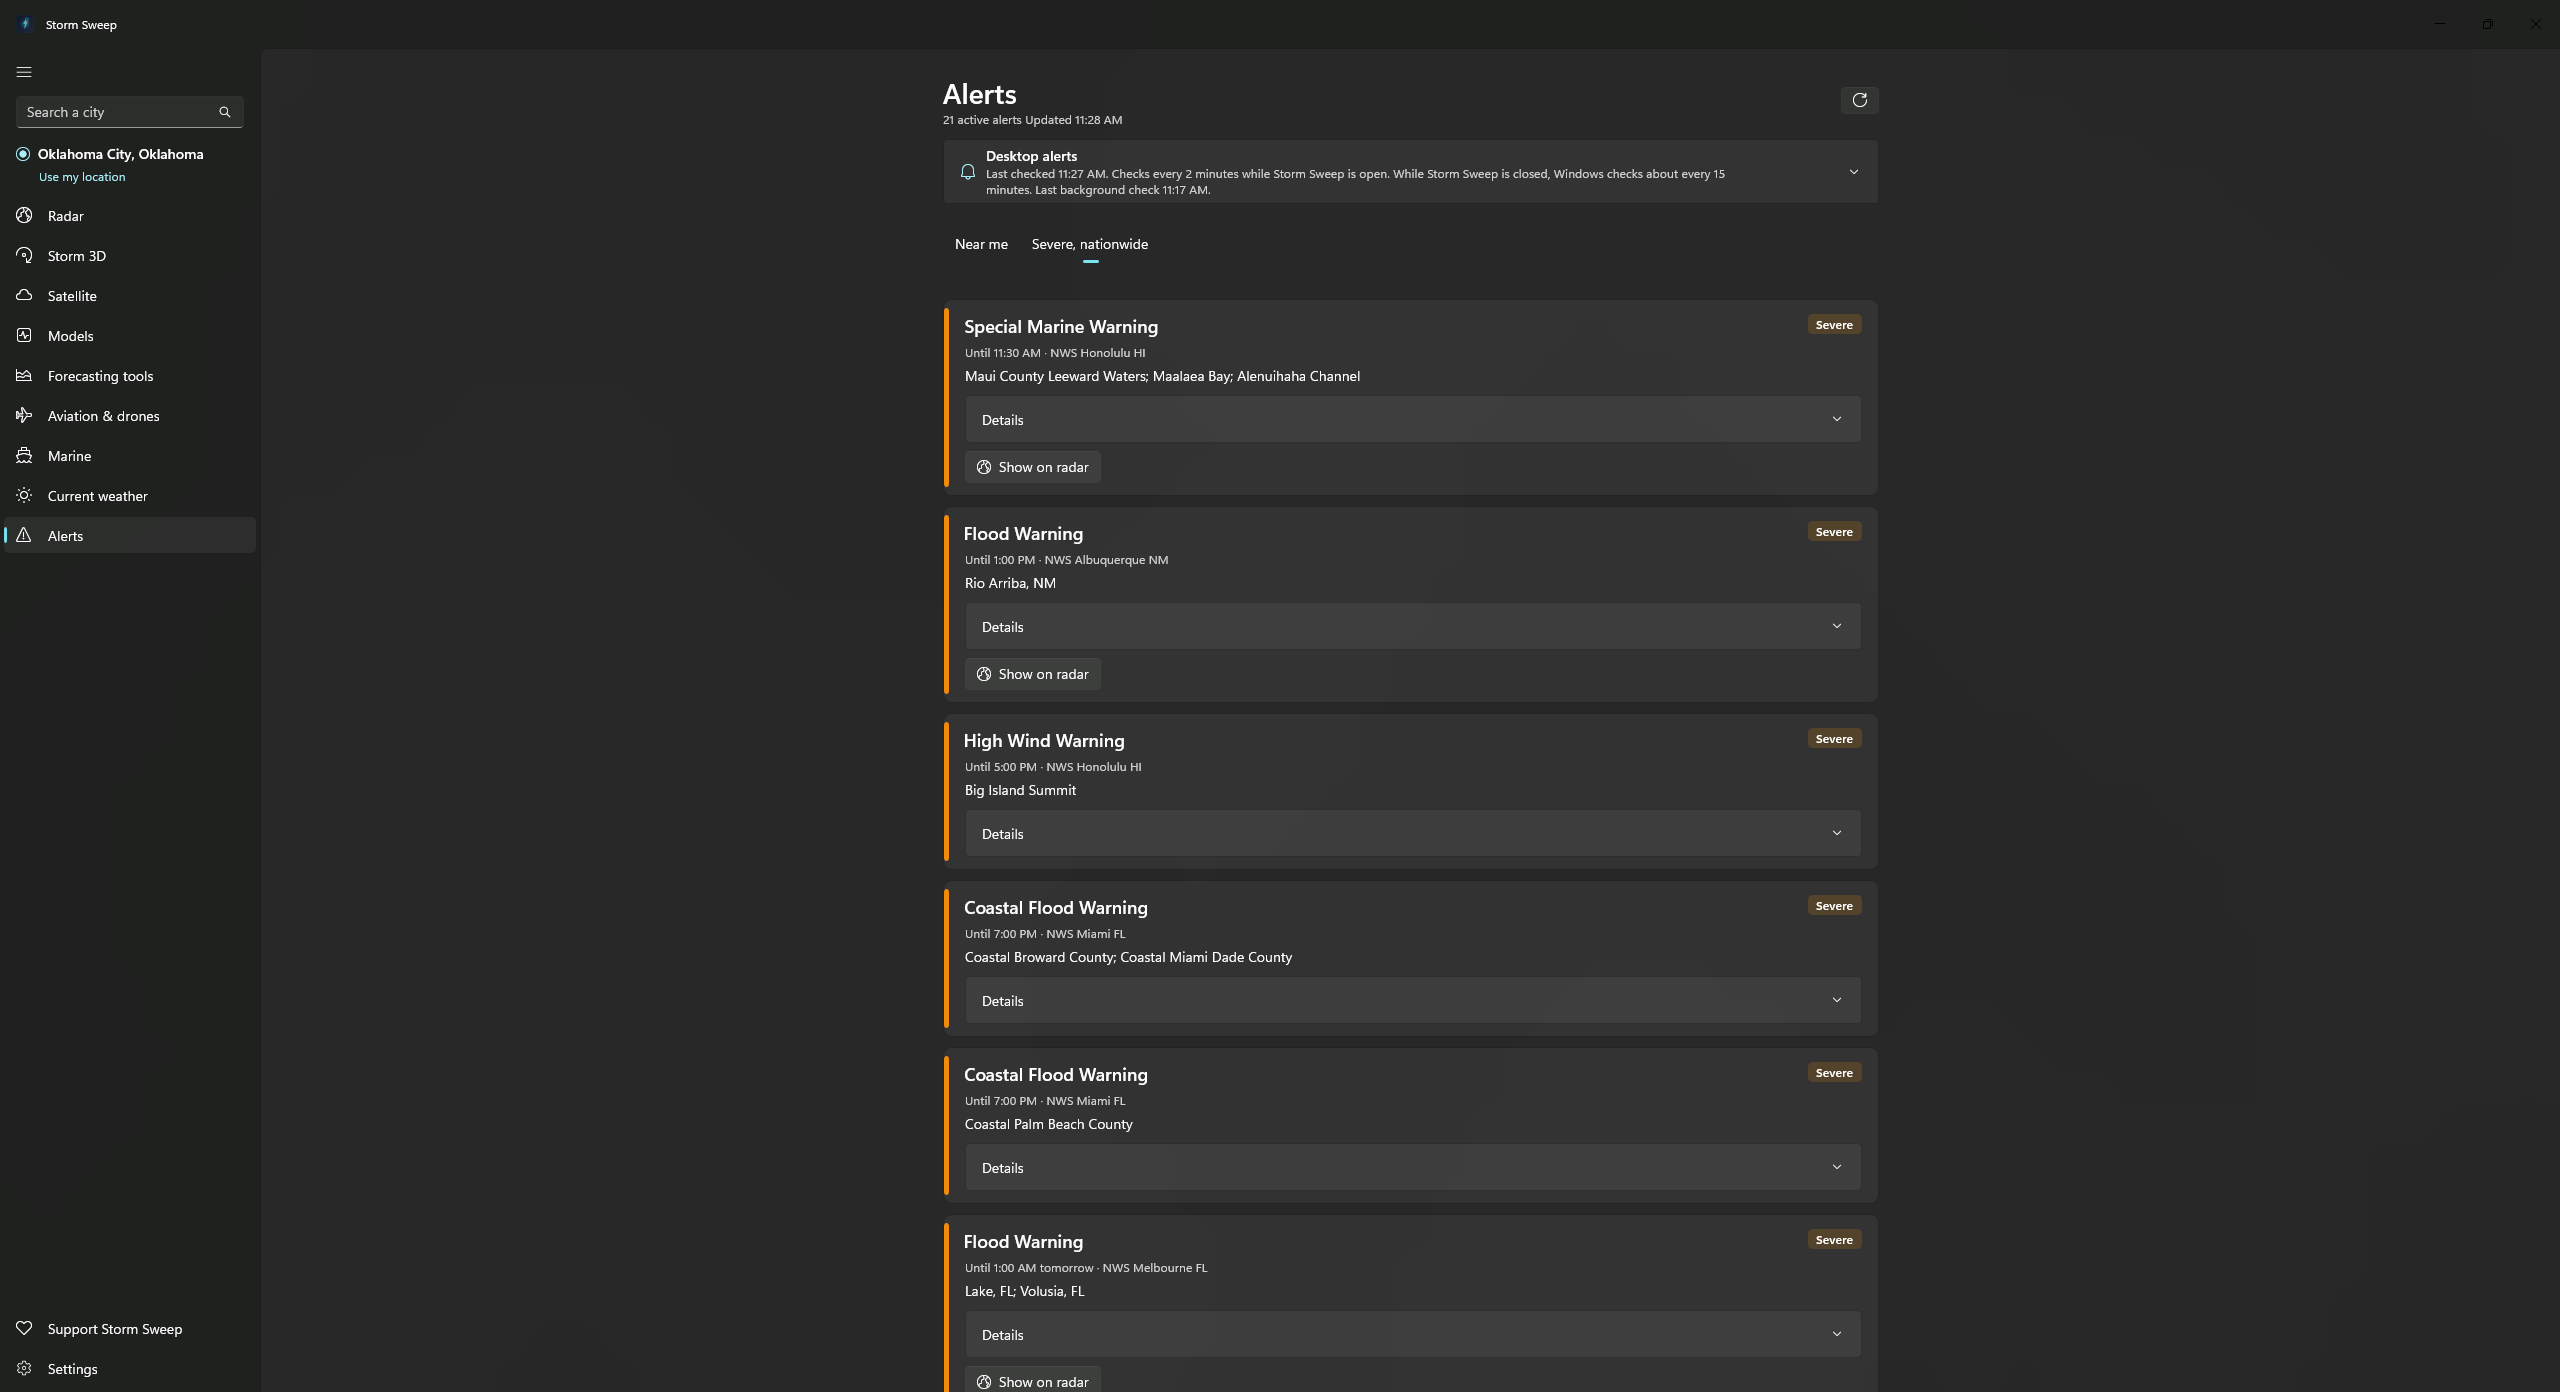
Live NWS alerts
Alerts for your location and a severe nationwide view, each card carrying the full bulletin rather than a headline. The Alerts tab stays the complete list for your location.
Notified at the next check, five at a time
A Windows notification at the next check after an alert is issued: within two minutes while the window is open, about fifteen minutes while it is closed. At most five per check, ordered most severe first, so an outbreak will not flood your notification centre. When more than five new alerts qualify in the same check the rest are not notified at all, and they are not held over for the next check either. An alert the Weather Service issues as an update to one Storm Sweep has already recorded, whether or not it reached you, is recorded silently rather than notified again, so the same warning never arrives twice, and one dropped by the five-at-a-time cap stays silent when the Weather Service updates it.
What is allowed to interrupt you
Three choices: warnings and emergencies, which is how it ships, so watches and advisories do not notify you until you change it; warnings and watches; or everything, advisories included. The Alert sound switch turns sound on or off. With Windows sounds, Tornado Warnings, emergencies and alerts rated Extreme get the alarm, other warnings and alerts rated Severe get the reminder sound, and the rest the default sound; Storm Sweep sounds use the three levels below.
Storm Sweep alert sounds, in three levels
A heads-up chime for watches and advisories, a repeating warning sound for warnings, and a critical sound for Tornado Warnings, emergencies, extreme warnings, Severe Thunderstorm Warnings the Weather Service tags destructive and G5/S5 space-weather alerts, which repeats until you dismiss it. Space-weather alerts use the same three levels. An alert’s level also follows the severity the Weather Service rates it: Extreme goes to the critical level and Severe to the warning level, whatever the alert is called, while watches, statements and outlooks keep the ordinary heads-up. Switch between “Storm Sweep sounds” and “Windows sounds” in Settings → Notifications. New installs start with Storm Sweep sounds; if you used an earlier version you keep your Windows sounds until you choose otherwise. A Tornado Watch is an ordinary notification, not the urgent alarm, and Windows mute and Do not disturb always win.
Checks continue while closed
A background task keeps checking roughly every fifteen minutes, Windows’ shortest repeating interval, when the app is installed from the Store. Windows decides when it really runs, and it can refuse background access to Storm Sweep altogether, so Settings reports whether the check is registered rather than leaving you to assume it.
Approaching-storm notices
Optional, and only while Storm Sweep is open on live radar with the storm overlay on, for storms the radar site on screen is tracking: when one showing rotation, a tornado vortex signature, likely severe hail or a 55 dBZ core is on course to pass within about 10 km of your location in the next 30 minutes, the app says roughly how many minutes out it is, once per storm, not repeatedly. This is Storm Sweep’s own radar estimate rather than an issued warning, and the notice says so. The radar tab’s Storms panel lists storms heading your way further out than that.
Offline city search
City search runs on your own PC against 32,333 places from the US Census Bureau’s 2024 National Places Gazetteer, bundled inside the app. Matching starts at the beginning of the name, so “Vegas” will not find Las Vegas, and it is place names only, not ZIP codes and not street addresses.
The detail: zone-only alerts, notification style and intervals
Polygons, and the alerts that have none
Any alert issued with a map polygon gets a button that opens the radar centred on its outline.
Alerts issued by zone code only (common for winter, heat and flood watches) have no polygon, so no button.
Notification style on Windows 11 and Windows 10
Tornado warnings, emergencies and anything the Weather Service marks extreme use Windows’ urgent style, which breaks through Focus, on Windows 11. That applies with Windows sounds; with Storm Sweep sounds, warning and critical alerts are alarm-style notifications that repeat until you dismiss them.
With Windows sounds, Windows 10 has no urgent style, so there the same alerts arrive as a reminder that stays on screen until you dismiss it, with the same alarm sound.
The two buttons on an alert notification
“Open radar” opens the radar, centred on that warning’s outline when it has one, and “Details” opens the Alerts tab.
Clicking either starts Storm Sweep first if it is closed.
The test alert
A test alert shows you what an ordinary warning looks and sounds like without waiting for real weather.
Typing a city
Type at least two letters and the matches appear without a request leaving your machine, with a state after a comma to narrow it, as in “Norman, OK”.
US only. Storm Sweep is not an official warning system and says so on the Alerts tab. Keep a NOAA Weather Radio or Wireless Emergency Alerts on and follow local officials.
NOAA’s long records, on one map
The Global tab sits after Alerts in the navigation pane. It puts NOAA’s climate, drought, records and storm history, ocean and ice, and station records on one map that opens as a globe, with a Flat | Globe switch and a United States | World button. It shows what NOAA and its partners published, each product labelled with its source, period of record and baseline. It gives no forecasts, and it never calls anything the worst, the best or unusual.
Climate
Climate at a Glance temperature and precipitation maps and charts for states, climate divisions and counties, with anomaly, value or rank, and timescales from one month to five years. Beside them: the nClimGrid monthly grid, nClimGrid-Daily county values since 1951, NOAAGlobalTemp global temperature departures since 1850, the U.S. Climate Extremes Index, U.S. Percentage Areas, and satellite upper-air temperature from UAH and NOAA STAR.
Drought
The U.S. Drought Monitor week by week since 2000 with its percent-of-area chart and the National Drought Mitigation Center’s credit in its own words, the Palmer drought indices by climate division, and the monthly North American Drought Monitor map from NOAA NCEI.
Extremes & history
State climate records, the U.S. national records, the NCEI Storm Events Database one year at a time, radar-detected storm cells, and historical tropical cyclone tracks from IBTrACS by basin. Storm Events changed its rules over the years, so counts across years are not like for like, and the app says so.
Ocean & ice
Daily sea surface temperature (OISST) and monthly since 1854 (ERSST), each with its anomaly; the Arctic sea ice edge, Northern Hemisphere snow and ice on the 24 km grid or the 4 km grid, Antarctic icebergs and U.S. snow depth; and sea floor and land relief. Relief and U.S. snow depth are also on the globe.
Stations
GHCN-Daily station records for the United States and its territories, with their 1991–2020 normals where NCEI has them, and U.S. Climate Reference Network stations with hourly readings, soil moisture and temperature at five depths, and a Monthly tab with maximum and minimum temperature, and mean temperature and precipitation in its table.
Search NOAA’s datasets
A OneStop search (Ctrl+F) finds NOAA datasets by words and date range. What you type goes only to NOAA OneStop, the map area is sent only if you turn “Search this map area” on, and the app does not save your search words.
Every value says what it is
Each product is tagged Observed, Analysis, Climatology, Record, Reported or Reference, shown with its period of record and baseline, and marked Preliminary where its producer says so. NCEI’s own ranks are shown as NCEI’s.
Nothing downloads until you pick it
A product downloads only when you pick it, and any single file over 10 MB asks first and shows its size and source; Cancel stops it. Products you have opened open again from their saved copy, labelled as one, even with no connection. Settings → Data & storage lists the downloads you agreed to, each with its own Delete.
Most Global products cover the United States only; the global ones are NOAAGlobalTemp, the satellite upper-air records, sea surface temperature, Northern Hemisphere snow and ice, Arctic ice, Antarctic icebergs, IBTrACS and relief. Data lags: the Drought Monitor is weekly, Climate at a Glance monthly, the newest ocean days are Preliminary, and IBTrACS leaves out the current season. The tab works offline only for products you have already opened. Relief and elevation are not for navigation. Storm Sweep is not affiliated with or endorsed by NOAA, NASA, the National Drought Mitigation Center or the University of Nebraska-Lincoln.
Earthquakes as USGS reports them, and NOAA’s history
Global Activity sits below Global in the navigation pane. It draws the earthquakes the U.S. Geological Survey reports on a globe or a flat map with a time bar, adds NOAA NCEI’s history of significant earthquakes, tsunami sources and volcanic eruptions, and has a Near your place panel. It shows reports as the agencies published them, with no forecasts, and it is not an official warning service.
The past hour to the past 30 days
Choose Past hour, Past day, Past 7 days or Past 30 days, and a magnitude of 2.5+ (the default), 4.5+, Significant or All. Dots grow with magnitude and are coloured by one of three depth classes, shallow, intermediate and deep, with heavier outlines for deeper ones so colour is never the only cue. A filled dot is an event USGS types as an earthquake and a hollow dot is any other type, named in its details.
Click for the details
Click a dot, or pick from the “Events in view” list. The card gives magnitude and its type, depth, the local and UTC times, USGS’s own Status and Alert words and its Felt number where it has them, the event id, and a “View on USGS” link that opens in your browser. Status and Alert are shown as USGS words them, without interpretation.
A time bar to replay them
A slider across the window shows events up to any moment, with Play and 1×, 2× and 4× speeds. A thin ring marks events in the hour before the time shown. Playback stays off when Windows animation effects are off, and the slider still works.
History from NOAA NCEI
Turn on History for NCEI’s Global Significant Earthquake, Historical Tsunami and Significant Volcanic Eruptions databases, with a Years slider from 2150 B.C. to now. History is off until you turn it on, loads in pages with a visible count, and asks first if a download would be over 10 MB. Its symbols are thin and carry dates, so they never read as current. NCEI’s own field names and values are shown as published.
Near your place
For the place saved on the Current weather tab: National Weather Service alerts about earthquakes, tsunamis, volcanoes or ashfall, shown as issued with their full text, and the USGS events within 100, 250 or 500 km, newest first, with distance and direction. For an Alaska place, links to Alaska Volcano Observatory information open in your browser. The distances are worked out on your PC from the events already on screen.
Saved copies, and what is sent
Each window and magnitude choice keeps its last good copy for up to 30 days, so offline the tab says “Saved copy from” its time. History keeps one complete copy per kind until a newer one replaces it. A request to USGS or NCEI carries only what is needed to name the feed or the page, plus your IP address as with any download; the tab never sends your place to them. Near your place also asks the National Weather Service for your saved place’s alerts about every 5 minutes while the tab is showing, with the same request the Alerts tab uses.
Global Activity is not an official warning service, and it makes no forecasts of earthquakes, aftershocks, tsunamis or eruptions, and no shaking or damage estimates of its own. It does not read the tsunami warning centers’ messages or show volcano observatories’ alert levels, and tsunami and volcano alerts reach the tab only as NWS alerts for your saved place. It describes no region or day as active or quiet. Outside the U.S. and a few other regions, small earthquakes are not reliably recorded, so counts are only what USGS published for the feed you chose. The “Past 30 days” feed with “All” is large, about 5 MB by the app’s own estimate. Earthquake data covers the whole globe. Storm Sweep is not affiliated with or endorsed by the U.S. Geological Survey.
More for Alaska
Alaska is inside Storm Sweep’s United States coverage, and 1.0.5 adds tools for it: a 3 km model you can download, a radar coverage panel, alerts drawn on the zones they name, sea ice, river gauges, and links to the agencies that serve the state.
HRRR Alaska, after you say yes
For a place on its grid, the Current Weather map shows a notice, “HRRR Alaska is available here”, while a layer it carries is on. It says GFS (about 25 km) is drawn now and HRRR Alaska is 3 km, gives the download size per forecast hour and for the whole time bar, and asks “Download it, or keep GFS?” GFS stays until you click Download. On the Models tab it is listed as “HRRR Alaska · 3 km” and usually moves the area to Alaska. A few fields, such as snowfall, 0–1 km and updraft helicity, the tornado parameter and wind shear, are not offered for it.
Radar coverage here
For an Alaska place, a panel on the Radar and Current Weather tabs lists the Alaska NEXRAD sites within 460 km with their distances, or says “No radar coverage here” and names the nearest site. It names its source, the nowCOAST Alaska base reflectivity mosaic, and the newest frame’s time. West of 170°W, such as Atka, Adak, Shemya and Attu, it says radar there is the model’s simulated radar only.
Alerts on the zones they name
For an Alaska place, the Current Weather map draws warnings, watches and advisories of every severity, and alerts issued by zone are drawn on the National Weather Service zones they name, credited “Zone boundaries: NOAA/NWS”. A zone with no outline is listed as not drawn, and no area is guessed.
Out to the western Aleutians
The GFS and ECMWF windows now run from 170°E across the date line, the Marine map draws the western Aleutians, and place search knows names such as Barrow (Utqiaġvik), Dutch Harbor (Unalaska) and Shemya (Eareckson Station), showing the official name.
Sea ice and river gauges
A “Sea ice (USNIC)” layer on the Marine map, off by default, draws the U.S. National Ice Center’s daily marginal ice zone chart for Alaska waters in two classes, shown as published. On Marine’s Rivers tool, “USGS gauges near you (Alaska)” lists the latest stage and discharge within about 1° of your place, with each reading’s approval status and the qualifier code as published, such as Ice.
Links to the people who serve Alaska
An “Alaska links” panel on the Current Weather map opens the FAA weather cameras and the avalanche centers for the Chugach, Hatcher Pass and the Alaska Avalanche Information Center in your web browser, and Global Activity opens Alaska Volcano Observatory information the same way. They are links only, and nothing is embedded or copied.
Six Alaska lessons
A Learn The Weather level on spring breakup and ice jams, ice fog, winter rain in the Interior, Juneau’s Suicide Basin glacial outburst floods, the volcano links, and sunrise and sunset in the far north.
HRRR Alaska is NOAA’s model for its own grid and is blank outside it. The GFS and ECMWF windows reach the western Aleutians, but HRRR Alaska on the Models tab is drawn only east of the date line. The app shows what the agencies publish and is not an official warning source. Storm Sweep is not affiliated with or endorsed by the Alaska Volcano Observatory or the Alaska avalanche centers.
The sky above the weather
Four tabs sit together in the navigation pane: Space Tracker, Space Weather, Space Forecast and Ionosphere & Radio. Orbits and pass times are worked out on your own PC from public data, every tab names its sources, and anything the app draws without measuring it is labelled “Illustration” or “App model”.
Space Tracker
A 3D Earth with its sunlit side and night lights, and satellites drawn where they are now: weather satellites, the ISS and stations, Starlink, other active satellites, selected debris events and rocket bodies. Filter by kind, search by name or NORAD number, and click an object for its altitude, speed, period, inclination, perigee and apogee, and how old its orbit data is. A geostationary weather satellite shows the ring of Earth it can see, and opens straight into the Satellite and Models tabs.
Passes over your place
For the ISS, brighter objects, Starlink trains or the object you picked: rise, peak and set times, directions, peak height, whether the object is sunlit, whether your sky is dark, and the National Weather Service sky-cover forecast for that hour. It needs a saved place.
Decaying orbits, shown as data
A list of the objects with the lowest perigee, lowest first, from CelesTrak, with a lesson on why orbits decay. It never gives a re-entry time or place.
Space Weather
NOAA’s R, S and G scales in NOAA’s own words, active regions, the GOES X-ray flux with flare classes, the Kp index, solar wind and Bz at L1, protons, and the aurora oval on the globe. Coronal mass ejections come from NASA’s DONKI with the model’s arrival time and a 3D cone labelled “Illustration”.
The Solar Loop
Four GOES SUVI loops in a 2×2 grid that play in step, with one Play/Pause, one slider and 1×, 2× or 4× speed. Choose any of the six wavelengths (94, 131, 171, 195, 284 and 304 Å), or NOAA’s SUVI feature map, and press a picture to enlarge it. “SDO latest” shows NASA’s newest still.
Coronagraph loops
Six views of coronal mass ejections leaving the Sun: GOES-19 CCOR-1 and SOLAR-1 CCOR-2, each in white light and as a running difference, plus SOHO LASCO C2 and C3. Every picture carries its publisher’s credit, CCOR-2 is tagged “Provisional”, and SOHO is a project of international cooperation between ESA and NASA.
Space Forecast
NOAA’s own 3-day outlook with its Kp forecast, the forecast discussion, and the 27-day and 45-day long-range outlooks, plus NOAA model runs placed on the globe where they apply: the OVATION aurora forecast, D-RAP radio absorption, GloTEC, WAM-IPE, Geospace ground magnetic disturbance and geoelectric field areas. Every frame is tagged Observed, Analysis, Forecast or “Model, earlier hours”, with the model run and valid time on your own clock where NOAA gives them.
CME arrival view
On the two Sun-to-Earth (WSA-Enlil) layers, a status line with a countdown, a time-bar marker and a dashed “Arrival (modeled)” ring show the arrival time NASA’s DONKI lists for a WSA-Enlil run, beside NOAA’s own run. The time is NASA’s published figure, not a Storm Sweep prediction.
Earth | Sun
A switch on Space Forecast and Space Weather. On Space Forecast the Sun view drapes the latest GOES SUVI 195 Å picture on the Earth-facing half of a 3D Sun, with NOAA’s active regions, the Sun’s turning over the next three days and NOAA’s Sun forecast. On Space Weather it drapes whichever Solar Loop picture you pick, 171 Å at first. The far side is plain.
What is the app’s own, and says so
The magnetopause, bow shock, plasmapause and the oval drawn from Kp are labelled “App model”; the radiation belts and the solar-wind streaks are labelled “Illustration”. None of them is NOAA output, and NOAA, NASA and ESA pictures keep their publishers’ own colours.
At your location
The aurora-oval value for your saved place, the hours the Sun is more than 12° below your horizon, and the forecast sky cover. It sets the facts side by side and deliberately never says whether you will see the aurora.
Ionosphere & Radio
Five views: D-RAP radio absorption from NOAA; an ionosphere foF2 map worked out on your PC from NOAA’s GloTEC; “Listening in a storm”, with your grid square and your nearest NOAA Weather Radio transmitters; Parks on the Air activations; and “Live arcs” of amateur-radio reception reports from the last 15 minutes, a 1% sample from PSKReporter, drawn between grid squares. Call signs are hidden unless you turn them on.
Optional space-weather alerts
Off until you switch them on in Settings. Choose how strong a geomagnetic storm (G), radiation storm (S) or radio blackout (R) must be before you are told. Alerts are NOAA’s own text, checked every two minutes while the app is open and about every fifteen minutes in the background when it is installed from the Store. No location is sent.
Space Tracker is not a source of collision, re-entry or spacecraft-operations information. Debris means selected debris events, not all debris. Positions come from public orbit data that ages, so they drift most for low, draggy objects, and the models are not to scale. NASA describes DONKI as prototyping-quality research context, and CME arrival times are model output, not an official forecast: NOAA’s Space Weather Prediction Center is the official U.S. source. The space tabs are not official warning channels, and the maps do not say which frequency will work. Storm Sweep is not affiliated with or endorsed by NASA, ESA or NOAA. The satellite and space data are global, but the nearest-transmitter list and the sky-cover forecast are US only.
A weather course, built into the app
145 short lessons in 16 levels, from reading a forecast to reading a Skew-T, a velocity couplet, a hurricane outlook, a geomagnetic storm or a drought map. Written for people who have never studied meteorology, and for people who want to read the radar the way forecasters do. It works offline and is free like everything else.
16 levels, 145 lessons
Weather basics; alerts and outlooks; radar, from how NEXRAD works to every radar product, including dual-pol and storm signatures; satellite; storm ingredients and soundings; forecast models; aviation and drones; marine; tropical and seasonal weather; space weather and radio; tornadoes; forecast models in depth; space-weather models; climate, oceans and history; earthquakes, tsunamis and volcanoes; and Alaska.
Try it as you read
Each lesson has steps to follow in the app itself. A “Show me” button takes you to the right tab, so you learn on the real radar, satellite or model, not on a picture of one.
Quick checks and level tests
A quick check closes each lesson, every level ends with a review and a test, and there is a final exam. Your progress is kept on your own PC.
Glossary and official guides
A glossary of weather terms, and a library of free guides from the National Weather Service and other official sources for when you want to go further.
Help that knows where you are
Press F1 on any tab for help with that tab. Help has its own search that understands everyday words, such as “why is the radar purple” or “wind for my drone”, and it works offline.
Original wording
The lessons are written for Storm Sweep and are part of the app, covered by the Terms of Use. They are teaching material, not a forecast or a warning: always follow the National Weather Service and local officials.
Colors you can read, and a key to every one
Settings → Color vision offers Standard, Red-green friendly and Blue-yellow friendly colors for the app’s own maps, legends and charts, and the change applies at once.
What changes
The radar color tables in Radar and Storm 3D, the models, the Current Weather layers, forecasting charts and the Skew-T, aviation, marine, the alert severity stripe, the space tabs, the legends and the Learn diagrams. Shapes, line patterns, hatching and words carry the meaning too, and warning outlines are labelled TOR, SVR and FFW in the friendly modes.
What keeps its publisher’s colors
NOAA’s own radar and satellite pictures, the NWS standard table and any .pal table you load, and the Sun and coronagraph pictures are shown as their publishers made them. Where a radar picture is NOAA’s, the Radar tab offers “Use Storm Sweep radar” and the Current Weather map offers “Use model radar”.
The Color key
Every color in the app is explained on each legend and on the Help page “Color key”, tab by tab. The Learn glossary card “Legend” opens it too.
No account. No analytics. No server.
Modus Creatio LLC operates no server for this app and receives no personal information about you. Nothing in the app touches the network until you have accepted the Terms of Use and the Privacy Policy.
No account, ever
You never create one or sign in. There is nothing to sign in to.
No analytics, no ads, no crash reporting
No telemetry of any kind. No advertising anywhere in the app. There is no automatic crash reporting and no send button. Unexpected errors go to a log file on your own PC, which you can read or delete in Settings.
Nothing loads before you accept
The first time you open Storm Sweep, an empty window shows one dialog: a short summary of the Terms of Use and Privacy Policy, with buttons to read either in full. Nothing behind it runs until you choose “I agree”: no page opens, no data is fetched, your location is not asked for, no notification is raised and the background alert check is not registered. Only then does a second step ask where you are, with a city search, a “Use my location” button and “Skip for now”; skip it and Storm Sweep opens with no place set until you choose one.
Requests identify the app, not you
Every request Storm Sweep makes carries one User-Agent naming the app and the support address, as the National Weather Service asks. No device id, no user id, no tracking token.
Stricter about what it downloads
Downloaded feeds are read with a size cap and a check that a small compressed file does not inflate into something enormous. Feed XML is read without following external references. The pages that draw the maps, 3D views and lessons now allow only the app’s own scripts. A bad or oversized download shows the usual “isn’t available right now” message instead.
Location is optional, and where that one position goes
“Use my location” asks Windows only when you click it, takes a single position fix (asking Windows for city-level accuracy, which is enough for weather) and saves one place. That position does leave your PC: it goes once to the National Weather Service to name the nearest town, and if that lookup fails the place is simply saved as “My location”. Either way the saved place keeps those coordinates, so from then on they go out with weather requests exactly like a place you searched for.
Your settings stay on your PC
One plain file in a Storm Sweep folder under your local app data holds your place, units, thresholds and preferences, plus your Learn The Weather progress and scores and your last ten Help searches. Storm Sweep never uploads that file, though the places inside it travel in the requests you make for them: your location’s coordinates, as above, and the radar, airport, tide station, buoy and river gauge you last looked at. Beside it can sit dated copies of that same file, kept for your protection: a backup written before a reset, and a copy of one the app could not read, the newest three of each. Those copies hold your chosen location too.
Sources named, Storm Sweep’s own figures labelled
Every tab that fetches data names where it came from, apart from Storm 3D: it downloads Level II volumes from the NEXRAD radar you pick on the Radar tab, and the credit for them sits on that tab rather than on its own. Anything Storm Sweep computed itself (hail estimates, upper-air analysis, storm motion) is labelled a Storm Sweep estimate rather than passed off as official.
The detail: the agreement gate, local files, the launch tab
When the agreement gate comes back
If a later version of those documents changes significantly, it asks again.
Location, after that single fix
Windows is never asked again on its own: there is no background tracking and no location history.
City search works without it.
What else sits in that folder
Beside the settings file and its dated copies sit caches of downloaded model, drone-airspace, orbit, space-weather and Sun-image data, and a list of alerts already shown so the same one never notifies twice.
Clearing the caches, resetting settings, forgetting saved places and learning progress
Settings → Data & storage lists each cache (drone airspace, model maps and space data) with its size on disk, and clears all three, apart from any file in use at that moment.
“Reset all settings” copies the settings file to a dated backup beside it first, and the confirmation dialog names that file, so your old settings are still on your disk afterwards; putting them back is a matter of renaming the file yourself, as the app offers no restore.
“Show safety notices again”, in the same Data & storage section, puts the Aviation, Drone check and Marine acknowledgements back in front of you the next time you open those tabs and changes nothing else.
Settings → Location has “Clear saved places”, which forgets the airport, route, tide station, buoy, river gauge, passage and the drone and marine points you last used while keeping your main location.
Settings → Learning & help has “Show tips again”, which brings back the short tip on each tab and the Skew-T chart tour, and “Reset learning progress”, which after a confirmation clears finished lessons, quick-check and test scores, the tips and the chart tour. In Help, “Clear recent searches” forgets what you searched for. “Reset all settings” clears all of these too, after copying them into the dated backup beside the settings file.
“Copy diagnostic info”
“Copy diagnostic info” puts your app and Windows versions, your settings without your location, and up to the last twenty lines of that error log on the clipboard and nowhere else, masking coordinates, map-tile paths and your own place names out of those lines before you paste them.
Which tab opens at launch
Settings → Startup sets what Storm Sweep opens on: Radar, which is how it ships, the last tab you were on, or any one of the other fifteen tabs, from Storm 3D to Learn The Weather. Settings, Support and Help never count as the last tab, so none of them is ever reopened that way.
Requests do reveal what you are looking at: the place you chose, the map area on screen, station identifiers and, in the Global tab’s dataset search, the words you type go to the public service providing that data (NOAA OneStop for the search) (the Live arcs view instead connects to the PSKReporter relay, a volunteer service, and only while that view is open), which sees your IP address like any website. Some feeds are hosted on AWS or Esri on an agency’s behalf, and ECMWF data is served from Europe. One thing does reach Modus Creatio, and only once Storm Sweep is listed in the Microsoft Store: Microsoft gives app publishers aggregated sales and acquisition reports for their Store apps. The app itself plays no part in that: all it asks the Store is whether a Supporter or Super Supporter subscription is active and until when, what those subscriptions cost, and, if you choose to subscribe, to open Microsoft’s own purchase dialog, which takes the payment; Modus Creatio never receives your payment details. The Privacy Policy below sets out the data flows, the providers and those Store reports in full.
Questions people ask
Is Storm Sweep really free?
Yes. Every feature is free, with no trial, no sign-in and no advertising. Two optional yearly subscriptions, Supporter at $5.99 and Super Supporter at $25.99, add only a thank-you badge and unlock nothing.
What does Storm Sweep run on?
Windows 10 version 2004 or later, or Windows 11, on x64, x86 or ARM64 PCs. It needs the free Microsoft Edge WebView2 Runtime, which Windows 11 includes, and an internet connection for live data. It is available from the Microsoft Store.
Where does the radar data come from?
Storm Sweep reads raw NEXRAD Level II radar files straight from NOAA and draws them on your own PC, with dual-polarization products at every tilt, in one, two or four linked panels. Satellite, models, alerts and the rest come from public agencies such as NOAA and the National Weather Service, and each tab names its sources.
Can I replay past storms?
Yes. Pick any past date at a NEXRAD site back to June 2008, or load one of five built-in cases: Moore 2013, El Reno 2013, Joplin 2011, Rolling Fork 2023 or Greenfield 2024.
Does it work outside the United States?
Weather coverage is United States only. The space and radio tabs and several Global tab records, such as sea surface temperature and historical tropical cyclone tracks, cover the whole world.
Is Storm Sweep an official warning system?
No. It is not affiliated with NOAA or the National Weather Service, and it should never be your only source of information. Follow official warnings and local officials, and keep NOAA Weather Radio or Wireless Emergency Alerts on.
Does it collect my data or need an account?
There is no account, no analytics, no advertising and no crash reporting. Your settings and learning progress stay on your PC. Each request carries only what it needs, such as the place or map area you are looking at, and your IP address like any internet request. The Privacy Policy lists every service.
What is Learn The Weather?
A free course built into the app: 145 short lessons in 16 levels, from weather basics to radar, satellite, soundings, models, space weather, NOAA long records, earthquakes, tsunamis, volcanoes and Alaska. Each lesson has steps you try in the app, a quick check, and each level ends with a review and test, plus a final exam.
Does Storm Sweep have color-blind friendly modes?
Yes. Settings has red-green friendly and blue-yellow friendly colors for the radar color tables, maps, legends and charts the app draws itself. NOAA, NASA and ESA pictures keep their publishers’ own colors, and a Color key explains every color.
What is in the Global tab?
NOAA’s long climate and weather records on one map: climate, drought, records and storm history, ocean and ice, and station records, plus a dataset search of NOAA OneStop. Nothing downloads until you pick a product, and any file over 10 MB asks first.
Free, with an optional way to say thanks
Every feature listed on this page is available to everyone at no cost. Nothing sits behind a paywall, a trial or a sign-in, and there are no ads anywhere in the app.
Radar, Storm 3D, satellite, models, forecasting tools, aviation and drones, marine, current weather, alerts, the space tabs and the Learn The Weather course. All of it, for everyone.
An entirely optional yearly subscription sold and billed by Microsoft. It unlocks nothing: a supporter gets a thank-you badge in the navigation pane and stops seeing the support reminder shown when the app starts. That is the complete list.
A bigger thank-you with its own badge, sold and billed the same way. It differs from Supporter only in price and badge, and it unlocks nothing extra either. The two are separate subscriptions: buying one does not change or cancel the other.
What the reminder is. Until you subscribe, one small dialog appears a few seconds after most launches: “Enjoying Storm Sweep?” It lists both badges with their prices, with “Yes” to support and “No”. It does not appear on your very first launch, over another dialog, or on a launch that opens from a notification, and choosing “No”, pressing Esc or closing it simply closes it until the next launch. Supporters and Super supporters never see it at all.
What cancelling does. When a paid period ends the badge goes away and the question comes back. No feature stops working, because no feature was ever tied to it. Cancelling happens in your Microsoft account rather than in the app, and “Manage subscription” (in Settings under Help & support, and on the Support page once you are a supporter) opens that account page for you. Supporter and Super supporter status follow the Microsoft account signed in to the Store, so the badge returns on its own after a reinstall or on another PC signed in to the same account; “Restore purchases”, in those same two places, asks the Store again if it hasn’t.
Storm Sweep is on the Microsoft Store, and the app itself is free to download. Both subscriptions are optional: the app shows the Store’s own formatted price for your market, and falls back to the listed $5.99 and $25.99 a year when the Store cannot be asked. Microsoft handles billing, renewal, cancellation and refunds throughout. Modus Creatio never sees your payment details.
What you need to run it
- Windows 10 version 2004 (build 19041) or later, or Windows 11.
- x64, x86 or ARM64. Storm Sweep ships for all three.
- Free disk space. Windows installs only the build for your processor: about 50 MB of package, roughly 130 MB once installed. Storm Sweep then keeps three caches on your own PC. Decoded model maps are trimmed as the app writes new ones, not on a schedule: least recently used first once that folder passes 768 MB, and any file more than four days old goes with them. A folder the app has stopped writing to stays as it is until you clear it yourself. Copies of FAA drone-airspace data are never trimmed: the national airspace layers, downloaded whole, plus one file for every quarter-degree facility-map tile you look at, each fetched again when it goes stale but kept until you clear it. Settings has a Data & storage section that shows the current size of each and clears them on request. The space-data cache (orbit, space-weather and Sun-image copies) is trimmed by age: entries older than 30 days are deleted the first time the cache is used. Downloads for the Global tab are kept in their own folders: automatic saved copies are capped at about 1 GB, least recently used trimmed first, and downloads you agreed to are never removed automatically; Settings → Data & storage lists them under “Global tab downloads”, each with its own Delete.
- Microsoft Edge WebView2 Runtime. Radar, Storm 3D, the model and forecasting maps, the sounding, the aviation and marine maps, the Current Weather map, the Global and Global Activity tabs, the four space views, and the Learn The Weather lessons all run inside it. Windows 11 includes it, and an up-to-date Windows 10 PC normally already has it through Microsoft Edge. Storm Sweep does not bundle it and cannot install it for you: where it is missing, each of those views says it couldn’t start and tells you to make sure the runtime is installed (the rest of Storm Sweep keeps working).
- A display with WebGL2 for raw radar, the model maps, Storm 3D and the Current Weather map. Without it those views say so rather than drawing something misleading.
- An internet connection. Every weather product is fetched live from public agency feeds. What ships inside the app is reference data rather than weather: the vector base map, the US Census place list behind city search (32,333 places), the 704 marine zone outlines, a list of 204 NEXRAD and TDWR radar sites used when the National Weather Service station list cannot be reached, and the 123 upper-air sites the sounding picker chooses from, and the Global tab’s own reference data: the county and climate-division outlines, the GHCN station list and the U.S. national records table.
- Location access is optional. Windows asks first, and city search works without it.
- Background alert checks need the Store build. The check runs as a Windows background task, which a copy without package identity cannot register, and Settings reports that it is “not available in this copy” instead of failing quietly.
- Checking any of this in the app. Settings carries the app name, the version, the publisher and a link to this site under About, plus shortcuts into Windows’ own location and notification settings. Help & support also has a “Rate Storm Sweep in the Microsoft Store” link, which has nothing to open until the listing is live.
- Accepting the Terms of Use and Privacy Policy on first launch. Until you agree, the window shows that gate and nothing else: nothing is downloaded, no notification is registered and no location is requested. “Close app” removes the background check and every Storm Sweep notification on the way out, so declining leaves nothing behind. The gate returns if the Terms version changes.
The .NET 10 runtime ships inside the package, and the package declares the Windows App SDK 1.6 runtime as a dependency rather than carrying it. WebView2 is the one prerequisite Storm Sweep neither carries nor declares. The bundled reference data is a dated snapshot that changes only when the app itself is updated: the marine zone outlines were built on October 27, 2026 from National Weather Service shapefiles, the place list comes from the 2024 Census gazetteer, and the compiled radar station list is only a fallback; the app refreshes that one from the National Weather Service API when it can.
What Storm Sweep doesn’t do
Worth knowing before you install it, rather than after.
- It is not an official warning system. Keep a NOAA Weather Radio or Wireless Emergency Alerts switched on and follow your local officials. The app says this too.
- Not for safety-of-life decisions. Data can be late, incomplete or wrong, and Storm Sweep should never be your only source of information for a decision where injury, loss of life or damage to property could follow. The app says this in the terms it asks you to accept before it starts.
- United States only. Weather coverage stops at the US, Alaska included: city search uses a US Census place list, and outside the US the app says so rather than guessing. Nearly every weather source is a US federal or US academic service; the exceptions are the ECMWF IFS forecast model, published by the European Centre for Medium-Range Weather Forecasts under CC BY 4.0, the space tabs’ orbit, catalog and amateur-radio feeds from CelesTrak, GCAT, Parks on the Air and PSKReporter, whose data is global, USGS earthquake reports and NOAA NCEI history in Global Activity, and several Global tab records, such as sea surface temperature and IBTrACS storm tracks.
- The national radar mosaic is lower-48 only, and so are the HRRR and RRFS model grids; HRRR Alaska covers Alaska, and the Current Weather map offers it after you agree to its download. Individual NEXRAD sites, live alerts, point forecasts and GOES imagery all work in Alaska, Hawaii and Puerto Rico; the satellite tab has its own sector for each. On the Models tab Hawaii and Puerto Rico are drawn only by GFS and ECMWF, through “Around me” or the North America area, and Alaska is also drawn by HRRR Alaska in the Alaska area. The Drone check reads the National Blend over all three, but NOAA offers no point download of the Blend’s grids outside the lower 48, so the whole field is pulled: hourly over Puerto Rico, every second hour over Hawaii, every third over Alaska, and the 24-hour table leaves the rows between blank. Its HRRR option covers the lower 48 and Alaska only, and in Alaska that every-third-hour gap stays even on HRRR for the precipitation and thunder chances and the gust spread, which always come from the Blend. The radar hail products need HRRR’s freezing and −20 °C heights, so maximum expected hail size, probability of severe hail and the hail figures on storm cells stop at the lower 48.
- A TDWR airport radar is a reduced picture. NOAA publishes the FAA’s terminal radars only as Level III, so a TDWR gives three low tilts of reflectivity and velocity: no dual-polarisation products or spectrum width, no Storm 3D, and no archive replay, which covers NEXRAD sites only. Where a panel’s product needs more than a TDWR carries, the panel says so and falls back to the national mosaic.
- The space tabs are not safety or warning tools. Space Tracker is not a source of collision, re-entry or spacecraft-operations information: debris means selected debris events, positions come from public orbit data that ages, and the decaying-orbits list never gives a re-entry time or place. Space Weather, Space Forecast and Ionosphere & Radio are not official warning channels, and NOAA’s Space Weather Prediction Center is the official source. The app never tells you whether you will see the aurora or which radio frequency will work.
- Global Activity reports earthquakes; it does not warn of them. It shows what USGS and NOAA NCEI publish, makes no forecasts of earthquakes, aftershocks, tsunamis or eruptions, does not read the tsunami warning centers’ messages or show volcano observatories’ alert levels, and describes no region as active or quiet. Tsunami and volcano alerts appear only as National Weather Service alerts for your saved place.
- No NOTAMs and no live flight tracking. Both were considered and deliberately left out.
- It is not a weather briefing. Pilots must still obtain a complete preflight briefing from an approved source, Flight Service (1-800-WX-BRIEF) or aviationweather.gov, and check current NOTAMs and TFRs before every flight. The pilot in command remains solely responsible for meeting 14 CFR 91.103. The app puts this in front of you the first time the Aviation section opens, and the aviation tools carry a footer reading “Not an official briefing · Not for navigation · NOTAMs not included”.
- The Drone check is planning information, not an authorization. The FAA UAS Facility Map is a draft map whose altitudes are pre-approved maximums for a request, and model visibility and cloud base come from a grid cell rather than your control station. It lists nearby National Park Service land, but no other local, state, park or property-owner rules are shown. There is no national dataset of them, so check B4UFLY or a LAANC provider, current TFRs and NOTAMs, and local laws before every flight.
- Nothing here is navigational. Marine zone outlines are simplified for drawing and lookup. NOAA chart images are a reference display NOAA itself states is not suitable for navigation and does not meet Coast Guard carriage requirements. Check the official marine forecast and warnings before departing, and keep a VHF radio aboard. The app asks you to accept that the first time you open the Marine tab, and every marine tool carries a footer pointing to the official forecast, Notices to Mariners and NOAA Weather Radio / VHF.
- The passage planner does not route. It is a timeline: the conditions at each point’s arrival time along the straight legs you enter, at one constant speed through the water. It does not choose or optimise a course, it does not avoid land, and it never advises.
- The UV index is an estimate. The National Weather Service does not publish a UV field, so Storm Sweep works out a clear-sky UV index on your PC from the height of the Sun. It leaves clouds out, and it is labelled an estimate on the map and on the conditions card.
- Nothing saves or exports. There is no image save, no data export, no printing and no copy of a view to the clipboard, on any tab. The only file the app reads is a .pal colour table you import for the radar.
- No account, cloud sync, mobile or web version. Windows desktop only, with your settings on your own PC.
- Not affiliated with NOAA, NASA, the National Weather Service, the FAA, the US Coast Guard, USGS, USACE, the National Park Service, the Alaska Volcano Observatory or the Alaska avalanche centers.
Section 6 of the Terms of Use is published below word for word, including the seven statements of what the app is not and the accuracy paragraph. The longer Aviation, Drone check and Marine notices stay in the app; the Data sources & safety notices tab below says where each one is. In the app’s own accuracy paragraph, data may be delayed, incomplete, inaccurate or unavailable, real-time observations may be preliminary, model output is guidance rather than an official forecast, and values Storm Sweep calculates itself (flight categories, density altitude, hail-size estimates, passage times, storm motion and arrival estimates among them) are estimates derived from imperfect data and may be wrong.
Terms, Privacy and Data sources
Published here in full, in the app’s own words, from the Terms of Use, Privacy Policy and Data sources & safety notices under Settings → Legal. One passage differs: in Data sources, the provider list is set out as a table with its own lead-in paragraph instead of the app’s bullet list. Storm Sweep asks you to accept the Terms of Use and Privacy Policy the first time you open it and loads nothing until you do, and it asks again if a later version changes them significantly. Version 1.4, effective November 7, 2026.
Terms of Use
These Terms of Use (the "Terms") are an agreement between you and Modus Creatio LLC ("Modus Creatio LLC", "we", "us") about your use of the Storm Sweep app for Windows (the "App"). Please read them carefully, especially section 6 (weather, aviation, drone, marine and space information) and sections 10 and 11 (no warranty and limitation of liability).
Jump to a section
- 1. Acceptance of these Terms
- 2. Who may use the App
- 3. Your license to use the App
- 4. The App is free; the supporter subscriptions are optional
- 5. Internet data and availability
- 6. Weather, aviation, drone, marine and space information
- 7. Third-party data and their terms
- 8. Acceptable use
- 9. Feedback
- 10. No warranty
- 11. Limitation of liability
- 12. Indemnification
- 13. Changes to the App and to these Terms
- 14. Termination
- 15. Governing law and venue
- 16. Severability
- 17. Entire agreement
- 18. Contact
1. Acceptance of these Terms
By installing, opening or using the App you agree to these Terms and to the Privacy Policy. If you do not agree, do not use the App and uninstall it.
2. Who may use the App
You may use the App if you are at least 13 years old and able to agree to these Terms where you live. If you are under the age of majority where you live, a parent or guardian must agree to these Terms for you.
You may not use the App where the law does not allow it.
You also represent that you are not located in, and will not use the App from, any country or territory, or as any person, that is subject to United States export controls or economic sanctions, and that you will comply with all export-control and sanctions laws that apply to you.
3. Your license to use the App
Modus Creatio LLC gives you a personal, non-exclusive, non-transferable, revocable license to install and use the App on Windows devices you own or control, for your own use, as these Terms allow.
The App is licensed, not sold. Modus Creatio LLC and its licensors keep all rights not expressly given to you, including all intellectual property in the App and its content (including its lessons, diagrams and text).
The App is distributed through the Microsoft Store. The Microsoft Store's Standard Application License Terms apply as the Store's default terms except where these Terms, as the App's own separate terms, govern. Any Microsoft Store term that must apply by law or under Microsoft Store policy still applies.
4. The App is free; the supporter subscriptions are optional
Every feature of the App is free for everyone. Nothing is locked behind a payment.
You may choose to buy one of two optional yearly subscriptions to help keep the App going: "Storm Sweep Supporter" or the higher-priced "Storm Sweep Super Supporter". They differ only in price and in the thank-you badge shown. Subscribers get a small thank-you badge and no longer see the support reminder shown when the App starts. That is all: each unlocks no features, and you miss nothing by not subscribing.
Until you subscribe, a short support reminder with only Yes and No appears each time you open the App (not on the very first launch, and never before you have accepted these Terms). Choosing No simply closes it and changes nothing. Subscribers never see it.
- Each subscription is sold and billed by Microsoft through the Microsoft Store, in your local currency, under Microsoft's terms. They are separate subscriptions: buying one does not change or cancel the other.
- Each renews each year until you cancel it in your Microsoft account. Canceling changes nothing in the App.
- Refunds are handled by Microsoft under Microsoft's refund policies.
- Prices may change; any change applies from your next renewal, as the Microsoft Store allows.
5. Internet data and availability
The App shows information that it downloads, when you use it, from public data providers, mostly agencies of the United States government. The App needs an internet connection for that, and your internet provider's charges apply.
We do not control those providers. Any of them may change, delay, interrupt or stop their data at any time, and the App may then show old, partial or no data for that product.
We are not responsible for any failure or delay caused by events beyond our reasonable control, including acts of nature, severe weather, failures or outages of the internet or of any data provider, power failures, or government action.
6. Weather, aviation, drone, marine and space information
Storm Sweep is not an official source of weather, aviation, drone, marine or space information. It is not affiliated with or endorsed by NOAA, NASA, ESA, the National Weather Service, NOAA's National Centers for Environmental Information (NCEI), the FAA, the U.S. Coast Guard, the U.S. Geological Survey, the U.S. Army Corps of Engineers, the National Park Service, or any other agency whose data it shows, nor by ECMWF, the National Drought Mitigation Center, the University of Nebraska-Lincoln, the University of Alabama in Huntsville, Iowa State University (the Iowa Environmental Mesonet), CelesTrak, GCAT, PSKReporter, Parks on the Air or Natural Earth, or any other organization or person whose data it shows. Nor is it affiliated with or endorsed by the Alaska Volcano Observatory (AVO), the Chugach National Forest Avalanche Information Center, the Hatcher Pass Avalanche Center or the Alaska Avalanche Information Center, whose websites its Alaska links open in your web browser. In particular, the App is:
- not an official warning or alerting service: always follow official warnings from the National Weather Service and instructions from local emergency officials, and keep another way to receive warnings (such as NOAA Weather Radio or Wireless Emergency Alerts);
- not a weather briefing: pilots must obtain a complete preflight briefing from an approved source, such as Flight Service;
- not an authorization of any kind: it does not grant, request or confirm airspace authorization for drones or aircraft, and it does not tell you whether a flight is legal;
- not for navigation: it does not replace official nautical or aeronautical charts, Notices to Mariners, NOTAMs, or NOAA Weather Radio and VHF marine broadcasts;
- not a source of elevation or depth for navigation: the relief and the elevation at a point on the Global tab come from NOAA NCEI's elevation models, which use different vertical datums and are not nautical charts;
- not a source of collision, re-entry or spacecraft-operations information: orbits come from public element sets and grow less accurate with age;
- not for safety-of-life decisions, and not to be relied on as your only source of information for any decision where injury, loss of life or damage to property could result.
Data may be delayed, incomplete, inaccurate or unavailable. Real-time observations may be preliminary. Model output is guidance, not an official forecast. Values that the App calculates itself — for example flight categories of forecast periods, wind components, density altitude, hail-size estimates, satellite positions, orbit details and pass times, the aurora forecast value for your place, foF2 worked out from NOAA GloTEC, grid squares, wave and sea-state model guidance, the Current Weather map's heat-stress (WBGT) and UV estimates and the humidity and wind shear it works out from model fields, the magnetopause, bow shock and aurora ovals the Space Forecast tab models from NOAA's numbers, the time left until a published CME arrival time, the distance and direction from your saved place to each event listed in the Global Activity tab's Near your place, route and passage times, twilight times, storm motion and arrival estimates, and unit conversions — are estimates derived from imperfect data and may be wrong. They are not official products and must not be used in place of them.
Animations that are not measured, such as a satellite's spin or the shape of a solar eruption, are labeled "Illustration" in the App.
Pictures that NOAA, NASA or ESA publish, such as NOAA's magnetosphere density picture and SUVI feature map, are shown unaltered, with their publisher's colors; the App does not read values from them. The same holds for the relief and snow depth pictures on the Global tab's globe, which are NOAA's map pictures placed on the globe unaltered. The Sun views place NOAA's Sun pictures on a 3D Sun on the side facing Earth only; the far side is left plain because it is not photographed. The Space Forecast tab's arrival view shows the CME arrival times that NASA DONKI lists from WSA-Enlil model runs, next to NOAA's own WSA-Enlil run; it marks those published times and does not predict an arrival itself.
The Global Activity tab shows earthquakes as USGS reports them and NOAA NCEI's records of past events, as published; it makes no forecasts of earthquakes, aftershocks, tsunamis or eruptions and is not an earthquake, tsunami or volcano warning service. Its "Near your place" list shows the National Weather Service alerts for your saved place whose names are about earthquakes, tsunamis, volcanoes or ashfall, as issued, and events within a distance you choose, which is your own filter, not an official area.
You are solely responsible for your decisions and for the safety and legality of what you do, including as pilot in command, as a remote pilot or recreational drone operator, or as master or operator of a vessel. Check the official sources before you act.
You use the App, and rely on any information in it, entirely at your own risk, and you assume all risk of any loss, injury, death or damage that may result from using the App or from being unable to use it. If you are not willing to accept this risk, do not use the App for any decision that affects safety.
The Aviation, Drone check and Marine sections each show their own, more detailed notice (Aviation & drones → About this data, the Drone check's notice, and Marine → About this data). Those notices form part of these Terms.
7. Third-party data and their terms
Most data shown in the App comes from agencies of the United States government and is generally in the public domain. The providers remain the source of that data, and their own terms and policies apply to it.
- FAA UAS Facility Map data: if you rely on the drone airspace data in the App, you also accept the FAA's terms of use for that data, published at https://www.arcgis.com/home/item.html?id=4254d2f81e5241cc8ba5883b63ae397c.
- ECMWF data is published by the European Centre for Medium-Range Weather Forecasts under the Creative Commons Attribution 4.0 International license (https://creativecommons.org/licenses/by/4.0/). The App shows ECMWF's attribution wherever that data appears.
- Satellite details from GCAT are published by Jonathan McDowell under the Creative Commons Attribution 4.0 International license (https://creativecommons.org/licenses/by/4.0/); the App credits them as "data from GCAT (J. McDowell, planet4589.org/space/gcat)".
- Satellite orbit data comes from CelesTrak, and amateur-radio activation spots from Parks on the Air (pota.app); the App credits both where it shows them.
- Live amateur-radio reception reports are used with the permission of PSKReporter (Philip Gladstone, N1DQ) and are received through the public PSKReporter MQTT relay operated by Tom M0LTE. The App credits them as "Reception reports: PSKReporter (Philip Gladstone, N1DQ) · live feed: PSKReporter MQTT relay (Tom M0LTE)".
- Coronagraph images from NOAA SWPC's GOES-19 CCOR-1 and SOLAR-1 (SWFO-L1) CCOR-2, and the satellite ground-station positions on Space Tracker from NOAA NESDIS, are public domain.
- SOHO LASCO coronagraph images come from ESA and NASA's SOHO mission through NOAA SWPC; the App credits them with SOHO's credit line: "Courtesy of SOHO/LASCO consortium. SOHO is a project of international cooperation between ESA and NASA."
- NASA's DONKI data comes from the Community Coordinated Modeling Center, which describes it as prototyping-quality information for research context; the App shows that notice with it. Sun images from NASA's Solar Dynamics Observatory are courtesy of NASA/SDO and the AIA, EVE, and HMI science teams.
- Drought on the Global tab: The U.S. Drought Monitor is jointly produced by the National Drought Mitigation Center at the University of Nebraska-Lincoln, the United States Department of Agriculture, the National Oceanic and Atmospheric Administration and the National Aeronautics and Space Administration. Map courtesy of NDMC. Storm Sweep is not affiliated with or endorsed by the National Drought Mitigation Center or the University of Nebraska-Lincoln. The Palmer drought indices come from NOAA NCEI's nClimDiv (the Climate Divisional Database), and the North American Drought Monitor's monthly map is shown as NOAA NCEI publishes it (North American Drought Monitor, via NOAA NCEI); the App credits them where it shows them.
- Climate maps and charts on the Global tab: NOAA NCEI's Climate at a Glance, nClimGrid (Vose et al. 2014, DOI:10.7289/V5SX6B56), nClimGrid-Daily (Durre et al. 2022, DOI:10.25921/c4gt-r169), NOAAGlobalTemp global temperature departures, the U.S. Climate Extremes Index and U.S. Percentage Areas; and satellite upper-air temperatures from the University of Alabama in Huntsville (UAH MSU/AMSU version 6.1) and NOAA NESDIS STAR (NOAA/STAR MSU/AMSU-A/ATMS version 5.0). The App credits them where it shows them.
- Sea surface temperature data on the Global tab: OISST v2.1 from NOAA National Centers for Environmental Information (Huang et al. 2021) and ERSST v5 from NOAA NCEI (Huang et al. 2017), through NOAA CoastWatch West Coast Node's ERDDAP server (NMFS SWFSC Environmental Research Division), whose license states that the data may be used and redistributed for free but is not intended for legal use, since it may contain inaccuracies; the App shows that note with the data.
- The relief and elevation values on the Global tab come from NOAA NCEI's DEM Global Mosaic, with the ETOPO 2022 Global Relief Model (doi:10.25921/fd45-gt74) as its worldwide base and the Continuously Updated Digital Elevation Model (CUDEM, doi:10.25921/ds9v-ky35) where a clicked point is read from a CUDEM tile; the App credits them where it shows them.
- Station data on the Global tab: GHCN-Daily (Menne et al. 2012, doi:10.7289/V5D21VHZ), the U.S. Climate Normals 1991-2020 and the Global Summary of the Month from NOAA NCEI, and the U.S. Climate Reference Network (USCRN; Diamond et al. 2013, doi:10.1175/BAMS-D-12-00170.1) from NOAA NCEI; the App credits them where it shows them.
- Records and storm history on the Global tab: state climate records from NOAA NCEI and the State Climate Extremes Committees; U.S. national records of the National Climate Extremes Committee (NCEC), NOAA NCEI, as the NCEC page gives them; the NCEI Storm Events Database (NWS Storm Data), shown as the reports give them; and radar-detected storm cells from NCEI's Severe Weather Data Inventory (SWDI). The App credits them where it shows them.
- Dataset search on the Global tab: NOAA OneStop (data.noaa.gov/onestop), NOAA National Centers for Environmental Information. Each dataset's own citation and use constraints are shown as the dataset gives them; links in search results open in your web browser.
- Historical tropical cyclone tracks on the Global tab: IBTrACS, the International Best Track Archive for Climate Stewardship (Knapp, K. R., M. C. Kruk, D. H. Levinson, H. J. Diamond and C. J. Neumann, 2010, Bull. Amer. Meteor. Soc., 91, 363-376; IBTrACS Version 4, NOAA NCEI, doi:10.25921/82ty-9e16), shown as the agencies give the tracks. The App credits it where it shows it.
- Snow and ice on the Global tab: the IMS daily snow and ice analysis, the Arctic marginal ice zone chart (also shown on the Marine map for Alaska waters) and the Antarctic iceberg positions come from the U.S. National Ice Center, and the snow depth and snow water equivalent pictures and values from NOAA's National Operational Hydrologic Remote Sensing Center (NOHRSC), shown as NOAA draws them; the App credits them where it shows them. The IMS 4 km grid is credited as NSIDC asks: "4 km grid: U.S. National Ice Center (2008), IMS Daily Northern Hemisphere Snow and Ice Analysis at 1 km, 4 km, and 24 km Resolutions, G02156, Version 1, National Snow and Ice Data Center, Boulder, Colorado, doi:10.7265/N52R3PMC." With it the App shows NSIDC's statement: "These servers should not be used to support operational observation, forecasting, emergency, or disaster mitigation."
- Earthquakes and past events on the Global Activity tab: the earthquake feeds come from the U.S. Geological Survey, credited as "Source: U.S. Geological Survey"; History comes from NOAA NCEI's NCEI/WDS Global Significant Earthquake Database (doi:10.7289/V5TD9V7K), NCEI/WDS Global Historical Tsunami Database (doi:10.7289/V5PN93H7) and NCEI/WDS Global Significant Volcanic Eruptions Database (doi:10.7289/V5JW8BSH), and each History card carries its database's credit line and DOI. Both are shown as the agencies publish them; the distances and directions from your place are worked out by the App.
- Alaska alert zones: the NWS public forecast zone outlines come from NOAA's NWS reference map service and are credited as "Zone boundaries: NOAA/NWS" where they are drawn; alerts are drawn on the zones they name, as issued.
- Outlines built into the App for the Global tab: state and county outlines from the U.S. Census Bureau's 2024 cartographic boundary files, climate-division outlines from NOAA NCEI, and world land and country lines from Natural Earth (public domain; made with Natural Earth, naturalearthdata.com). The Earth images on the App's globes are NASA's Blue Marble and Black Marble (NASA Earth Observatory, public domain), also built into the App.
- Other providers, such as the Iowa Environmental Mesonet, make their data available under their own terms.
- Open-source components included in the App are licensed under their own licenses, listed in Settings → Third-party notices.
- Links to outside websites (such as the Reference library, the sources listed under lessons, the Alaska links on the Current Weather and Global Activity tabs, and USGS event pages) open in your web browser. Those sites are run by others and are not part of the App. We do not control them and are not responsible for them, their content or their availability; their own terms and privacy policies apply to your visit.
Showing data from a provider, or linking to a website, does not mean that the provider or site endorses the App, or that we endorse the site.
8. Acceptable use
When you use the App, and afterwards as to anything you have obtained from it, you agree not to:
- copy, modify, decompile, reverse engineer or disassemble the App, except to the extent the law allows despite this limit;
- extract, copy or reuse the App's program files, code, scripts, lessons, diagrams or other content from its installation package, by hand or by automated means, except to the extent the law allows despite this limit;
- use the App, its lessons, diagrams, text or other content, or anything obtained from it, to train, fine-tune or evaluate any artificial-intelligence or machine-learning model, or to build a dataset for that purpose;
- use the App, or automated tools, bots or AI agents driving it, to scrape, bulk-download, resell or redistribute data from the App or its providers;
- use the App in a way that overloads, interferes with or misuses any data provider's service, or that breaks their terms or usage limits;
- remove or hide the App's notices, disclaimers or attributions, or present the App's information as official or as your own;
- use the App for any unlawful purpose.
Modus Creatio LLC reserves all rights to text and data mining of the App and its content, including for the purposes of any law that allows rights holders to reserve them. Public government data shown in the App remains subject only to its providers' terms.
9. Feedback
If you send us ideas or suggestions about the App, you allow Modus Creatio LLC to use them without any obligation to you.
10. No warranty
TO THE FULLEST EXTENT PERMITTED BY LAW, THE APP AND ALL INFORMATION IN IT ARE PROVIDED "AS IS" AND "AS AVAILABLE", WITH ALL FAULTS AND WITHOUT WARRANTY OF ANY KIND, WHETHER EXPRESS, IMPLIED OR STATUTORY. MODUS CREATIO LLC DISCLAIMS ALL WARRANTIES, INCLUDING WARRANTIES OF MERCHANTABILITY, FITNESS FOR A PARTICULAR PURPOSE, TITLE, NON-INFRINGEMENT, ACCURACY, TIMELINESS AND COMPLETENESS, AND ANY WARRANTY THAT THE APP OR ITS DATA WILL BE UNINTERRUPTED, ERROR-FREE OR AVAILABLE.
Some places do not allow some of these exclusions. In those places, they apply only as far as the law allows.
11. Limitation of liability
TO THE FULLEST EXTENT PERMITTED BY LAW, MODUS CREATIO LLC AND ITS MEMBERS, MANAGERS, EMPLOYEES AND LICENSORS WILL NOT BE LIABLE FOR ANY INDIRECT, INCIDENTAL, SPECIAL, CONSEQUENTIAL, EXEMPLARY OR PUNITIVE DAMAGES, OR FOR ANY LOSS OF PROFITS, DATA, USE OR GOODWILL, ARISING OUT OF OR RELATED TO THE APP, THE INFORMATION IN IT, OR THESE TERMS, OR TO YOUR RELIANCE ON ANY OF THEM, WHETHER IN CONTRACT, TORT (INCLUDING NEGLIGENCE) OR OTHERWISE, AND EVEN IF ADVISED OF THE POSSIBILITY OF SUCH DAMAGES.
OUR TOTAL LIABILITY FOR ALL CLAIMS RELATED TO THE APP OR THESE TERMS IS LIMITED TO THE GREATER OF (A) THE AMOUNTS YOU PAID TO MODUS CREATIO LLC, OR THROUGH THE MICROSOFT STORE, FOR THE STORM SWEEP SUPPORTER AND STORM SWEEP SUPER SUPPORTER SUBSCRIPTIONS IN THE 12 MONTHS BEFORE THE EVENT GIVING RISE TO THE CLAIM, OR (B) US $50.
Some places do not allow the exclusion or limitation of certain damages, so some or all of the above may not apply to you.
NOTHING IN THESE TERMS EXCLUDES OR LIMITS LIABILITY THAT CANNOT BE EXCLUDED OR LIMITED BY LAW, INCLUDING LIABILITY FOR DEATH OR PERSONAL INJURY CAUSED BY NEGLIGENCE, FOR FRAUD OR FRAUDULENT MISREPRESENTATION, OR FOR GROSS NEGLIGENCE OR WILLFUL MISCONDUCT. THE EXCLUSIONS AND LIMITS IN SECTIONS 10 AND 11 APPLY ONLY TO THE EXTENT THE LAW ALLOWS.
12. Indemnification
To the extent the law allows, you agree to defend, indemnify and hold harmless Modus Creatio LLC and its members, managers and employees from any claims, losses, damages and costs (including reasonable legal fees) arising from your misuse of the App, your breach of these Terms, your violation of any law or of anyone else's rights (including the terms of any data provider), or any claim by a third party arising from a decision you made in reliance on the App.
13. Changes to the App and to these Terms
We may change, add or remove features of the App, or stop offering it, at any time.
We may update these Terms. When we do, we will change the version and effective date shown at the top. For a significant change, the App will ask you to review and accept the updated Terms before you continue to use it. For a minor change, we will tell you in the App, and continuing to use it means you accept the update. If you do not accept an update, stop using the App.
14. Termination
You may stop using the App at any time by uninstalling it. Your license ends automatically if you break these Terms, and we may end it if we stop offering the App.
When your license ends you must stop using the App. The second paragraph of section 3 and sections 6 to 18 continue to apply. Ending the license does not cancel a Supporter or Super Supporter subscription; cancel that in your Microsoft account.
15. Governing law and venue
These Terms are governed by the laws of the State of Oklahoma, United States of America, without regard to its conflict-of-laws rules. Any dispute arising from these Terms or the App will be brought only in the state or federal courts located in the State of Oklahoma, and you and Modus Creatio LLC agree to the personal jurisdiction of those courts.
If you are a consumer, this section does not take away any protection you have, or any right to bring proceedings, under the mandatory consumer-protection laws of the state or country where you live.
16. Severability
If any part of these Terms is found to be unenforceable, that part will be enforced as far as possible and the rest of these Terms will remain in full effect.
17. Entire agreement
These Terms, the Privacy Policy and the notices referred to in section 6 are the entire agreement between you and Modus Creatio LLC about the App, and replace any earlier agreement about it. If we do not enforce a part of these Terms, that is not a waiver of it. You may not transfer these Terms; we may transfer them to a successor of the App.
18. Contact
Modus Creatio LLC. For support or questions about Storm Sweep, email modus_creatiollc@pm.me. Any further contact details will be published on the Storm Sweep website, https://moduscreatio.com/storm-sweep.
Privacy Policy
This Privacy Policy explains what the Storm Sweep app for Windows (the "App"), published by Modus Creatio LLC, does with information. In short: the App has no account, no analytics, no advertising and no tracking. What you set up stays on your PC. To show weather data, the App asks public data providers for it, and those requests include the place or map area you are looking at.
Jump to a section
1. What the App does not collect
- No account: you never sign up or sign in to Modus Creatio LLC.
- No analytics, telemetry or usage statistics, and no crash reports sent anywhere.
- No advertising and no advertising identifiers.
- No tracking across apps or websites.
- No AI: Storm Sweep itself runs no AI, machine learning or classifier, and some NOAA pictures it shows (the SUVI feature map) are produced by NOAA's own software.
- No text recognition (OCR).
- Modus Creatio LLC does not receive, sell, rent or share your personal information. We do not run a server that the App reports to.
2. What stays on your PC
The App stores these only on your PC, in your Windows user profile (the StormSweep folder under your local app data):
- your settings, including your chosen location, layer and display choices, the airports, routes, drone and marine points you last used, the limits you set, and the Current Weather map's layers, pins and last view, and the home marker you place on the radar; your color vision choice; and the product, view (Flat or Globe) and options you last used on the Global tab and the Earth or Sun view you last used on the space tabs, and the choices you last made on the Global Activity tab;
- your learning progress and recent Help searches: the Learn The Weather lessons you have finished, the last lesson you opened, your best quick-check and test scores, which tips and chart tours you have seen, and the last ten things you typed into Help search. They are kept in the same settings file and are never sent to anyone. "Reset learning progress" in Settings clears the lessons, scores and tips, and "Clear recent searches" in Help clears the searches;
- caches of downloaded model, drone-airspace, orbit, space-weather and Sun-image data and of the Alaska forecast zone outlines, and a list of alerts already shown so they are not repeated;
- the Global tab's saved data (the GlobalData and GlobalCache folders there): saved copies of what a Global product last showed, so the tab works offline, kept under about 1 GB in all with the least recently used removed first; and the files you agreed to download, such as a Storm Events year or a hurricane history basin, kept as compact copies that are never removed automatically. The App asks before any single download over 10 MB, every time, and shows its size. Settings → Data & storage → "Global tab downloads" shows how much the Global tab keeps and deletes each download on request. The Global Activity tab keeps one saved copy of each USGS feed you have opened and of NCEI's History records in the same folders, so that tab also works offline. A saved copy of a USGS feed older than 30 days is never shown and is deleted the first time the tab asks for a feed in each App session and whenever it saves a feed, and the USGS feed copies are kept under 30 MB in all. NCEI's History records are kept as one complete copy of each kind until a newer complete load replaces it, inside the Global tab's limit of about 1 GB; when a newer load can't be completed, that copy is shown, whatever its age, with "Saved copy from" and its date; the working copies in GlobalCache are removed 30 days after they were fetched;
- for the Storm Sweep widget on the Windows Widgets board: a small file (widget-card.json) beside your settings, written at each alert check, that holds your saved place's name, the time of the last alert check, up to 20 of the alerts then in effect (event name, area, severity and end times), how many there were and the end times of the rest, and a short code computed from the place's name and coordinates (the coordinates themselves are not written to this file) so the widget can tell when you choose another place. After you change places it keeps the old place's name until the next check replaces it. If you turn desktop alerts off, the App stops writing it, and the file keeps the last place's name and alerts until the widget's own check replaces them, you choose Close app in the Terms dialog, or you uninstall the App. Choosing Close app in the Terms dialog deletes it, and uninstalling the App removes it;
- a local error log (errors.log) recording any crash, so a problem can be investigated if you choose to share it. It is never sent automatically.
- copies of your settings that the App makes for your protection: a backup (settings.backup-….json) before you choose "Reset all settings", and a copy of a settings file it could not read (settings.corrupt-….json). Only the newest three of each are kept. Like your settings, they can include your chosen location, your learning progress and your recent Help searches.
This information is not sent to us. When you uninstall the App, Windows normally removes it; you can also delete it yourself.
3. What is sent, and to whom
To show data, the App sends requests directly from your PC to the public data providers listed below. Depending on the feature, a request can contain the latitude and longitude of your chosen place, the map area on screen, station, airport, buoy or gauge ids, a route you enter, or the words you type in the Global tab's dataset search (sent only to NOAA OneStop). The city search runs on your PC and sends nothing. Many national products (radar files, satellite images, model files and outlooks, and the Global Activity tab's earthquake feeds and History records) are requested without any location at all.
Like any internet request, each request also reveals your device's IP address to the provider. The App identifies itself in each request as StormSweep, with Modus Creatio LLC's support email address (its User-Agent), as the National Weather Service requires; it sends no identifier for you or your device.
Each provider handles the requests it receives under its own privacy policy. Some data is served from Amazon Web Services or Esri ArcGIS Online on the provider's behalf. Some providers are outside the United States (for example ECMWF, in Europe), so a request you trigger may be served from, or sent to, another country.
Links to outside websites (the Reference library, the sources listed under lessons, the Alaska links on the Current Weather and Global Activity tabs, such as FAA WeatherCams, the Alaska avalanche centers, the Alaska Volcano Observatory and the USGS Volcano Notification Service, and USGS event pages) open in your own web browser, not inside the App. Your browser then contacts that website directly, which reveals your IP address to it, and that website's own privacy policy applies. The App sends those websites no information.
The providers are:
- NOAA National Weather Service (api.weather.gov, tgftp.nws.noaa.gov, www.weather.gov): Alerts, forecasts, current conditions and the 24-hour trend, station observations, forecast discussions and other text products, marine zone forecasts, the town name for "Use my location", and the NOAA Weather Radio transmitter list; the alerts for your saved place in the Global Activity tab's Near your place; and, for an Alaska place or an Alaska radar, Alaska's list of active alerts, so that alerts NWS issues by forecast zone can be drawn on the zones they name on the Radar and Current Weather maps. Sent: The latitude and longitude of your chosen place (for its alerts, alerts/active?point= with the latitude and longitude to 4 decimal places), forecast zone, office and station ids; for Alaska's alert list (alerts/active?status=actual&area=AK), only the state code AK, nothing about you, sent only while your chosen place is in Alaska or an Alaska radar is chosen and warnings are shown on the map, at most once every 2 minutes.
- NWS Aviation Weather Center (aviationweather.gov): METARs, TAFs, PIREPs, SIGMETs, G-AIRMETs and winds aloft. Sent: Airport ids, the route you enter and the map area on screen.
- NOAA Storm Prediction Center and Weather Prediction Center (www.spc.noaa.gov, mapservices.weather.noaa.gov): Convective, fire-weather and extended outlooks, watches, excessive-rainfall outlooks and precipitation forecasts, and the NOHRSC national snow analysis on the Global tab; and Alaska's NWS public forecast zone outlines (NOAA's NWS reference map service), for drawing Alaska alerts on the zones they name. Sent: Nothing about you: national products only; for the Global tab's snow layer, the map area on screen, or the point you click; for the Alaska zone outlines, one request for all of Alaska's zones (the state code AK), sent only when an Alaska alert is to be drawn on its zones, with a saved copy used for 30 days (a failed request is tried again after 6 hours).
- NOAA National Hurricane Center (www.nhc.noaa.gov): The list of active tropical storms, for the Current Weather map's hurricane layer; each storm's forecast track, forecast cone and past track come from NHC's layers on mapservices.weather.noaa.gov. Sent: Nothing about you: only the request itself and the App's User-Agent, no location.
- NOAA NCEP (radar mosaic and model files) (opengeo.ncep.noaa.gov, nomads.ncep.noaa.gov): The national radar mosaic and model data. Sent: The map area on screen, or the area and point a model request covers.
- NOAA Open Data Dissemination on Amazon Web Services (unidata-nexrad-level2.s3.amazonaws.com, unidata-nexrad-level3.s3.amazonaws.com, noaa-nexrad-level2.s3.amazonaws.com, noaa-hrrr-bdp-pds.s3.amazonaws.com, noaa-rrfs-ops-pds.s3.amazonaws.com, noaa-gfs-bdp-pds.s3.amazonaws.com, noaa-nbm-grib2-pds.s3.amazonaws.com): Level II and Level III radar files, HRRR, RRFS, GFS, GFS-Wave and NBM model files, and the HRRR Alaska model files (in the same HRRR bucket) that the Current Weather map uses for a place inside HRRR Alaska's grid once you agree to its size notice. Sent: The radar site id or model run requested; no location beyond that. For HRRR Alaska, the list of the newest run's files and that run's small index file, to show the download size in the notice, and the model files only after you choose Download.
- ECMWF open data (via Amazon Web Services) (ecmwf-forecasts.s3.amazonaws.com and its CloudFront distribution (d2zvc0wgha4k2l.cloudfront.net), and data.ecmwf.int (ECMWF's own open-data server, used when the Amazon copy is busy)): ECMWF IFS model data, published under CC BY 4.0. Sent: The model run requested only.
- NOAA NESDIS / STAR (cdn.star.nesdis.noaa.gov, www.star.nesdis.noaa.gov): GOES satellite imagery, and the STAR satellite upper-air temperature record on the Global tab. Sent: The satellite sector requested only; for the upper-air record, nothing about you (the same files for everyone).
- NOAA ocean and coastal services (api.tidesandcurrents.noaa.gov (CO-OPS), www.ndbc.noaa.gov (NDBC), nowcoast.noaa.gov, gis.charttools.noaa.gov): Tides, currents and water levels, buoys, marine map layers and NOAA chart images, and the observed radar on the Current Weather map. Sent: Station and buoy ids and the map area on screen.
- NOAA National Water Prediction Service (api.water.noaa.gov): River gauges and forecasts. Sent: Gauge ids and the map area on screen.
- NOAA Space Weather Prediction Center (services.swpc.noaa.gov): The Kp index on the Drone check and Space Tracker; the Space Weather tab (Sun images, X-ray flux and flares, the Kp index and NOAA's G, S and R scales, solar wind, the aurora forecast, radiation and F10.7); the Space Forecast tab (NOAA's 3-day and 27-day outlooks and forecast text, the solar-cycle progression, active regions, ICAO space-weather advisories, the solar wind numbers of NOAA's WSA-Enlil run and NOAA's propagated solar wind used by the arrival view, and space-weather model pictures such as WAM-IPE, Geospace, including the magnetosphere density picture, and WSA-Enlil); the Sun pictures of the Sun views on both space tabs; the Ionosphere & Radio tab (D-region absorption and the experimental GloTEC ionosphere maps); the GOES-19 CCOR-1 and SOLAR-1 CCOR-2 coronagraph images, and the SOHO LASCO coronagraph images SWPC republishes; solar-wind spacecraft positions; and space-weather alerts. Sent: Nothing about you: national products only.
- CelesTrak (celestrak.org): Satellite orbit data, the satellite catalog totals and the list of decaying orbits on Space Tracker. Sent: Nothing about you: the same catalog-wide files for everyone.
- NASA Goddard Space Flight Center (CCMC DONKI and the Solar Dynamics Observatory) (ccmc.gsfc.nasa.gov, sdo.gsfc.nasa.gov): Coronal mass ejections and their published model arrival times (also for the Space Forecast tab's arrival view), and the latest Sun image on the Space Weather tab. Sent: Nothing about you: a date range or the image requested.
- NASA Johnson Space Center (ISS trajectory) (nasa-public-data.s3.amazonaws.com): The International Space Station's predicted path, for its passes on Space Tracker. Sent: Nothing about you: one public file.
- GCAT, Jonathan McDowell (planet4589.org) (planet4589.org): Owner, launch vehicle, mass and parent event in Space Tracker's details, published under CC BY 4.0. Sent: Nothing about you: catalog-wide files only.
- Parks on the Air (POTA) (api.pota.app): Amateur-radio activation spots on the Ionosphere & Radio tab. Sent: Nothing about you: the same public list for everyone.
- PSKReporter (pskreporter.info), through the PSKReporter MQTT relay (mqtt.pskreporter.info): Live amateur-radio reception reports, drawn as arcs on the Ionosphere & Radio tab while its Live arcs view is open; places are shown only as 4-character grid squares, call signs only if you switch them on, and the reports are kept in memory for 15 minutes and never saved. Sent: Nothing about you beyond your IP address: a random connection name and a subscription to the same 1% sample of reports that everyone gets.
- NOAA NESDIS (ground-station positions) (bundled in the app (no request)): The positions of NOAA's Wallops and Fairbanks satellite ground stations on Space Tracker, from NOAA NESDIS station pages. Sent: Nothing: the positions are built into the App.
- U.S. Geological Survey (carto.nationalmap.gov, api.waterdata.usgs.gov): Base-map and street tiles, and stream observations, including the Rivers tab's card of USGS gauges near an Alaska place. Sent: The map area on screen and gauge ids; for the Alaska gauges card, a box about 2 by 1.6 degrees around your chosen place (with none chosen, the last Marine point you opened), rounded outward to 0.1 degree and split in two where it crosses 180 degrees, with the parameter code for stage or discharge; nothing is asked for a place outside Alaska.
- U.S. Geological Survey (earthquake feeds) (earthquake.usgs.gov): The real-time earthquake summary feeds on the Global Activity tab, read only while the tab is showing; an event's USGS page opens in your web browser. Sent: Nothing that names you or your place: only the feed's address, which names the window and magnitude you chose, and the App's User-Agent; like every request, it reveals your IP address; no place and no search text. Near your place is worked out on your PC. Cookies the site sets are not kept.
- NOAA National Centers for Environmental Information (historical event databases) (www.ngdc.noaa.gov): History on the Global Activity tab: NOAA NCEI's records of significant earthquakes, tsunami sources and volcanic eruptions from its historical event databases, loaded page by page while History is on and the tab is showing (a complete saved copy younger than 30 days is used with no request). Sent: Nothing that names you or your place: only the address of the page of records asked for (the kind of event and a page number) and the App's User-Agent; like every request, it reveals your IP address; no place and no search text. Cookies the site sets are not kept.
- U.S. Army Corps of Engineers (Inland ENC, hosted on Esri ArcGIS Online) (services7.arcgis.com): Inland waterway reference data such as bridge clearances. Sent: The map area on screen.
- Federal Aviation Administration (tfr.faa.gov, nasstatus.faa.gov, and FAA layers hosted on Esri ArcGIS Online (services6.arcgis.com)): Temporary flight restrictions, airport delay status, UAS Facility Maps and airspace layers. Sent: The map area or point you check.
- National Park Service (hosted on Esri ArcGIS Online) (services1.arcgis.com): Park boundaries on the Drone check. Sent: The point you check.
- Iowa Environmental Mesonet, Iowa State University (mesonet.agron.iastate.edu): Storm reports, archived warnings, upper-air soundings and watch details. Sent: The map area, time range or station requested.
- National Drought Mitigation Center, University of Nebraska-Lincoln (U.S. Drought Monitor) (droughtmonitor.unl.edu, usdmdataservices.unl.edu): The weekly U.S. Drought Monitor map and its percent-of-area statistics on the Global tab. Sent: The week requested and, for statistics, the date range you choose.
- NOAA National Centers for Environmental Information (www.ncei.noaa.gov): The Global tab's Climate at a Glance temperature and precipitation maps and time series, nClimGrid monthly grids and nClimGrid-Daily county values, global temperature departures, U.S. Climate Extremes Index and U.S. Percentage Areas, Palmer drought indices by climate division, the North American Drought Monitor monthly map pictures, GHCN-Daily and U.S. Climate Reference Network (USCRN) station observations, normals and monthly summaries, USCRN monthly values, state climate records (State Climate Extremes Committees), the Storm Events Database year files, radar-detected storm cells (Severe Weather Data Inventory, SWDI), historical tropical cyclone tracks (IBTrACS basin files) and the preview pictures of the dataset search. Sent: The product, index, variable, month, day, timescale, region or language you choose (the same files for everyone) and, for a state's chart, NCEI's state number and the baseline years you pick; for a station you click, its station id and the dates of the range you choose (USCRN: the station's file for the year, and for its monthly values the list of USCRN's monthly files and the station's monthly file); for Storm Events, the year file you agree to download; for radar-detected cells, the date and the map area on screen; for IBTrACS, the basin file you agree to download (and, when you press Check for updates, a request for that file's date and size); for a dataset preview, the dataset's picture address (the same for everyone), sent only when you press 'Show the preview picture'. Cookies the site sets are not kept.
- NOAA OneStop (data.noaa.gov): Dataset search on the Global tab. Sent: The words you type in the search box, the date range if you set one, a keyword you pick from the search's own keyword list, and the map area on screen only when 'Search this map area' is on; for 'Show files in this area', the dataset you picked and the map area on screen. Your search words are sent only to NOAA OneStop, and the App does not save them. Cookies the site sets are not kept.
- NOAA CoastWatch West Coast Node ERDDAP (NMFS SWFSC Environmental Research Division) (coastwatch.pfeg.noaa.gov): Daily (OISST) and monthly (ERSST) sea surface temperature grids on the Global tab, and their values over time at a point you click; OISST's sea-ice concentration when the U.S. National Ice Center's chart can't be used. Sent: The dataset, date and map area on screen; for a time series, the point you click (not your saved place unless you click there).
- U.S. National Ice Center (usicecenter.gov): Antarctic iceberg positions, IMS daily snow and ice (the 24 km grid, and the 4 km grid when you choose it), and the daily Arctic sea ice chart (marginal ice zone) on the Global tab; and the same sea ice chart on the Marine map for Alaska waters when you switch on its sea ice layer. Sent: Nothing about you: the same current files for everyone.
- NOAA NCEI elevation and bathymetry services (gis.ngdc.noaa.gov): Shaded-relief elevation and sea-floor depth images, and the elevation at a point you click, on the Global tab. Sent: The map area on screen, or the point you click (not your saved place unless you click there).
- University of Alabama in Huntsville (UAH) (www.nsstc.uah.edu): UAH satellite upper-air temperature anomalies (MSU/AMSU version 6.1) on the Global tab. Sent: Nothing about you: the same files for everyone.
- U.S. Census Bureau (bundled in the app (no request)): City search, from the Census Gazetteer place list built into the App, and the state and county outlines for the Global tab's maps, built into the App (2024 cartographic boundary files). Sent: Nothing: the search runs on your device.
- Natural Earth (bundled in the app (no request)): The world land and country lines of the Global tab's world view, built into the App (Natural Earth 1:50m data, public domain; made with Natural Earth, naturalearthdata.com). Sent: Nothing: the outlines are built into the App.
- NOAA National Centers for Environmental Information (bundled outlines and lists) (bundled in the app (no request)): The climate-division outlines of the Global tab's maps, the GHCN-Daily station list (U.S. and territories) and the U.S. national records of the National Climate Extremes Committee, built into the App. Sent: Nothing: the outlines and lists are built into the App.
4. Your location
You can choose a place by searching for a city, or use "Use my location". Location is optional: the App works fully with a searched place.
"Use my location" asks Windows for your position, only when you select it and only if you have allowed location access for the App in Windows Settings. The App uses that position once, to set your chosen place (looking up the nearest town name from the National Weather Service), and saves it only as your chosen place, just as if you had searched for it. It does not track your location in the background or keep a history of it.
You can turn location access off at any time in Windows Settings → Privacy & security → Location.
5. Alerts and notifications
Desktop alerts are on unless you turn them off. While they are on and you have chosen a place, the App checks the National Weather Service for active alerts for that place every few minutes while it is open, and a Windows background task checks about every 15 minutes while it is closed. Those checks send the same kind of request described in section 3.
Space-weather alerts are off unless you turn them on. While they are on, the App checks the NOAA Space Weather Prediction Center's alert list every few minutes while it is open, and the same Windows background task checks it about every 15 minutes while it is closed. These checks send no location: the list is the same for everyone.
While the Global Activity tab is showing and you have saved a place, it asks the National Weather Service for that place's alerts about every 5 minutes, with the same kind of request; it sends no notifications or sounds of its own.
If you add the Storm Sweep widget ("NWS alerts") to the Windows Widgets board, it shows the National Weather Service alerts for your saved place from the latest alert check. While the widget is shown, Storm Sweep looks every 5 minutes and, when its saved alert list is more than 10 minutes old, makes that same check itself, with the same request described in section 3, even when desktop alerts are off and the App is closed; removing the widget from the board stops these checks. Storm Sweep hands the widget's text to Windows, and Windows draws the Widgets board; anyone who can see your screen can see your saved place's name and its alerts there.
After you choose Close app in the Terms dialog, a widget already on the Widgets board keeps showing its last card until Windows next asks Storm Sweep to update it; then it says to open Storm Sweep and accept the Terms, and nothing is requested.
Notifications are created on your PC by Windows; the App uses no push-notification service. You can turn desktop alerts off in the App, or turn Storm Sweep's notifications off in Windows Settings.
6. Microsoft Store purchases
The optional Storm Sweep Supporter and Storm Sweep Super Supporter subscriptions are sold, billed and managed by Microsoft through the Microsoft Store, under Microsoft's privacy statement. Modus Creatio LLC does not receive your payment details. The App only asks the Microsoft Store whether either subscription is active (which one, and until when), and remembers the answer on your PC so the badge shows when you are offline. It sends that answer to no one.
Microsoft may give app publishers aggregated sales and acquisition reports for apps in the Microsoft Store.
7. Microsoft's own processing
Some parts of Windows and the Microsoft Store that the App relies on handle information under Microsoft's own terms and the Microsoft Privacy Statement, not under this policy:
- The App's maps and other web pages run in Microsoft Edge WebView2, the web view built into Windows. WebView2's SmartScreen reputation check is left on, and it may send the addresses of pages the App opens to Microsoft.
- Windows and Microsoft Edge diagnostic data follow your Windows settings (Settings → Privacy & security → Diagnostics & feedback).
- Purchases and app updates go through the Microsoft Store, under Microsoft's own terms and the Microsoft Privacy Statement (section 6 describes the optional subscriptions).
- The Windows Widgets board, where the Storm Sweep widget's text (your saved place's name and its alerts) is shown, is part of Windows and is handled under Microsoft's own terms and the Microsoft Privacy Statement.
Modus Creatio LLC receives none of this information.
8. Children
The App is not directed to children under 13, and it does not knowingly collect personal information from anyone, including children.
9. Security
The App downloads data over encrypted connections (HTTPS, and TLS for the live radio reports). Information stored on your PC is protected by your Windows account; keep your PC and account secure.
10. Your choices
You can change or clear your chosen place, turn desktop alerts off, turn space-weather alerts on or off, turn location access off in Windows, delete the Global tab's downloads in Settings → Data & storage, and delete the App's local data by uninstalling it. Because Modus Creatio LLC does not hold personal information about you, there is nothing for us to access, correct or delete on a server.
Because the App collects no personal information and Modus Creatio LLC operates no server and receives no data about you, data-protection laws such as the EU and UK GDPR and the California Consumer Privacy Act (CCPA/CPRA) place few obligations on us, and we do not "sell" or "share" personal information as those laws define it. If you are in the EU, the UK, California or a similar place and have a question about your rights, you can contact us (see the Contact section).
11. Changes to this policy
If the App's handling of information changes, we will update this policy, change the version and effective date shown at the top, and tell you in the App before the change applies.
12. Contact
Modus Creatio LLC. For support or questions about Storm Sweep, email modus_creatiollc@pm.me. Any further contact details will be published on the Storm Sweep website, https://moduscreatio.com/storm-sweep.
Data sources & safety notices
Storm Sweep brings together public weather, aviation, drone, marine and space-weather data. This page summarizes how to treat it and where each section's full notice is.
Jump to a section
1. Not an official source
Storm Sweep is not an official source and is not affiliated with or endorsed by NOAA, NASA, ESA, the National Weather Service, NOAA's National Centers for Environmental Information (NCEI), the FAA, the U.S. Coast Guard, USGS, USACE, the National Park Service or any other agency whose data it shows, nor by ECMWF, the National Drought Mitigation Center, the University of Nebraska-Lincoln, the University of Alabama in Huntsville, Iowa State University (the Iowa Environmental Mesonet), CelesTrak, GCAT, PSKReporter, Parks on the Air or Natural Earth, or any other organization or person whose data it shows. Nor is it affiliated with or endorsed by the Alaska Volcano Observatory (AVO), the Chugach National Forest Avalanche Information Center, the Hatcher Pass Avalanche Center or the Alaska Avalanche Information Center, whose websites its Alaska links open in your web browser.
Always follow official warnings from the National Weather Service and instructions from local emergency officials.
2. How to treat the data
- Data may be delayed, incomplete, inaccurate or unavailable. Products show their source and issue time; check them.
- Model output is guidance, not an official forecast.
- Values marked "computed" are worked out by Storm Sweep and are estimates.
- Not for navigation, not a weather briefing, not an authorization, and not for safety-of-life decisions.
- Elevation and depth on the Global tab (relief and the elevation at a point) are reference values from NOAA NCEI's elevation models. Not for navigation.
3. Where each section's full notice is
- Aviation: Aviation & drones → About this data. For situational awareness and flight-planning support only; obtain a complete preflight briefing from Flight Service. NOTAMs are not included.
- Drone check: shown the first time you open the Drone check, and in full under Aviation & drones → About this data. Planning information only, not an authorization; check B4UFLY or a LAANC provider, TFRs, NOTAMs and local rules.
- Marine: Marine → About this data. Not for navigation; it does not replace official charts, Notices to Mariners, or NOAA Weather Radio and VHF broadcasts.
- Global: each product's info panel names its source, its kind of value and its credit, and Help → Global explains saved copies and large downloads.
- Global Activity: Help → Global Activity. Earthquakes as USGS reports them and NOAA NCEI's records of past events, shown as published, each with its credit; no forecasts, and not a warning service.
- Space Tracker, Space Weather, Space Forecast and Ionosphere & Radio: each tab's About or Help page. Orbits and pass times are computed by the App from public data; illustrations are labeled; Storm Sweep is not affiliated with or endorsed by NASA, ESA or NOAA.
- Models: each model's credit and license is shown with its data (for example ECMWF's CC BY 4.0 attribution).
4. Data providers
Storm Sweep contacts the services below. Each row names what that service provides and what a request to it carries. Your IP address is visible to any service you contact, as with any website, and each provider handles that under its own privacy policy.
| Service | Used for | What the request carries |
|---|---|---|
| NOAA National Weather Service api.weather.gov, tgftp.nws.noaa.gov, www.weather.gov | Alerts, forecasts, current conditions and the 24-hour trend, station observations, forecast discussions and other text products, marine zone forecasts, the town name for "Use my location", and the NOAA Weather Radio transmitter list; the alerts for your saved place in the Global Activity tab's Near your place; and, for an Alaska place or an Alaska radar, Alaska's list of active alerts, so that alerts NWS issues by forecast zone can be drawn on the zones they name on the Radar and Current Weather maps | The latitude and longitude of your chosen place (for its alerts, alerts/active?point= with the latitude and longitude to 4 decimal places), forecast zone, office and station ids; for Alaska's alert list (alerts/active?status=actual&area=AK), only the state code AK, nothing about you, sent only while your chosen place is in Alaska or an Alaska radar is chosen and warnings are shown on the map, at most once every 2 minutes |
| NWS Aviation Weather Center aviationweather.gov | METARs, TAFs, PIREPs, SIGMETs, G-AIRMETs and winds aloft | Airport ids, the route you enter and the map area on screen |
| NOAA Storm Prediction Center and Weather Prediction Center www.spc.noaa.gov, mapservices.weather.noaa.gov | Convective, fire-weather and extended outlooks, watches, excessive-rainfall outlooks and precipitation forecasts, and the NOHRSC national snow analysis on the Global tab; and Alaska's NWS public forecast zone outlines (NOAA's NWS reference map service), for drawing Alaska alerts on the zones they name | Nothing about you: national products only; for the Global tab's snow layer, the map area on screen, or the point you click; for the Alaska zone outlines, one request for all of Alaska's zones (the state code AK), sent only when an Alaska alert is to be drawn on its zones, with a saved copy used for 30 days (a failed request is tried again after 6 hours) |
| NOAA National Hurricane Center www.nhc.noaa.gov | The list of active tropical storms, for the Current Weather map's hurricane layer; each storm's forecast track, forecast cone and past track come from NHC's layers on mapservices.weather.noaa.gov | Nothing about you: only the request itself and the App's User-Agent, no location |
| NOAA NCEP (radar mosaic and model files) opengeo.ncep.noaa.gov, nomads.ncep.noaa.gov | The national radar mosaic and model data | The map area on screen, or the area and point a model request covers |
| NOAA Open Data Dissemination on Amazon Web Services unidata-nexrad-level2.s3.amazonaws.com, unidata-nexrad-level3.s3.amazonaws.com, noaa-nexrad-level2.s3.amazonaws.com, noaa-hrrr-bdp-pds.s3.amazonaws.com, noaa-rrfs-ops-pds.s3.amazonaws.com, noaa-gfs-bdp-pds.s3.amazonaws.com, noaa-nbm-grib2-pds.s3.amazonaws.com | Level II and Level III radar files, HRRR, RRFS, GFS, GFS-Wave and NBM model files, and the HRRR Alaska model files (in the same HRRR bucket) that the Current Weather map uses for a place inside HRRR Alaska's grid once you agree to its size notice | The radar site id or model run requested; no location beyond that. For HRRR Alaska, the list of the newest run's files and that run's small index file, to show the download size in the notice, and the model files only after you choose Download |
| ECMWF open data (via Amazon Web Services) ecmwf-forecasts.s3.amazonaws.com and its CloudFront distribution (d2zvc0wgha4k2l.cloudfront.net), and data.ecmwf.int (ECMWF's own open-data server, used when the Amazon copy is busy) | ECMWF IFS model data, published under CC BY 4.0 | The model run requested only |
| NOAA NESDIS / STAR cdn.star.nesdis.noaa.gov, www.star.nesdis.noaa.gov | GOES satellite imagery, and the STAR satellite upper-air temperature record on the Global tab | The satellite sector requested only; for the upper-air record, nothing about you (the same files for everyone) |
| NOAA ocean and coastal services api.tidesandcurrents.noaa.gov (CO-OPS), www.ndbc.noaa.gov (NDBC), nowcoast.noaa.gov, gis.charttools.noaa.gov | Tides, currents and water levels, buoys, marine map layers and NOAA chart images, and the observed radar on the Current Weather map | Station and buoy ids and the map area on screen |
| NOAA National Water Prediction Service api.water.noaa.gov | River gauges and forecasts | Gauge ids and the map area on screen |
| NOAA Space Weather Prediction Center services.swpc.noaa.gov | The Kp index on the Drone check and Space Tracker; the Space Weather tab (Sun images, X-ray flux and flares, the Kp index and NOAA's G, S and R scales, solar wind, the aurora forecast, radiation and F10.7); the Space Forecast tab (NOAA's 3-day and 27-day outlooks and forecast text, the solar-cycle progression, active regions, ICAO space-weather advisories, the solar wind numbers of NOAA's WSA-Enlil run and NOAA's propagated solar wind used by the arrival view, and space-weather model pictures such as WAM-IPE, Geospace, including the magnetosphere density picture, and WSA-Enlil); the Sun pictures of the Sun views on both space tabs; the Ionosphere & Radio tab (D-region absorption and the experimental GloTEC ionosphere maps); the GOES-19 CCOR-1 and SOLAR-1 CCOR-2 coronagraph images, and the SOHO LASCO coronagraph images SWPC republishes; solar-wind spacecraft positions; and space-weather alerts | Nothing about you: national products only |
| CelesTrak celestrak.org | Satellite orbit data, the satellite catalog totals and the list of decaying orbits on Space Tracker | Nothing about you: the same catalog-wide files for everyone |
| NASA Goddard Space Flight Center (CCMC DONKI and the Solar Dynamics Observatory) ccmc.gsfc.nasa.gov, sdo.gsfc.nasa.gov | Coronal mass ejections and their published model arrival times (also for the Space Forecast tab's arrival view), and the latest Sun image on the Space Weather tab | Nothing about you: a date range or the image requested |
| NASA Johnson Space Center (ISS trajectory) nasa-public-data.s3.amazonaws.com | The International Space Station's predicted path, for its passes on Space Tracker | Nothing about you: one public file |
| GCAT, Jonathan McDowell (planet4589.org) planet4589.org | Owner, launch vehicle, mass and parent event in Space Tracker's details, published under CC BY 4.0 | Nothing about you: catalog-wide files only |
| Parks on the Air (POTA) api.pota.app | Amateur-radio activation spots on the Ionosphere & Radio tab | Nothing about you: the same public list for everyone |
| PSKReporter (pskreporter.info), through the PSKReporter MQTT relay mqtt.pskreporter.info | Live amateur-radio reception reports, drawn as arcs on the Ionosphere & Radio tab while its Live arcs view is open; places are shown only as 4-character grid squares, call signs only if you switch them on, and the reports are kept in memory for 15 minutes and never saved | Nothing about you beyond your IP address: a random connection name and a subscription to the same 1% sample of reports that everyone gets |
| NOAA NESDIS (ground-station positions) bundled in the app (no request) | The positions of NOAA's Wallops and Fairbanks satellite ground stations on Space Tracker, from NOAA NESDIS station pages | Nothing: the positions are built into the App |
| U.S. Geological Survey carto.nationalmap.gov, api.waterdata.usgs.gov | Base-map and street tiles, and stream observations, including the Rivers tab's card of USGS gauges near an Alaska place | The map area on screen and gauge ids; for the Alaska gauges card, a box about 2 by 1.6 degrees around your chosen place (with none chosen, the last Marine point you opened), rounded outward to 0.1 degree and split in two where it crosses 180 degrees, with the parameter code for stage or discharge; nothing is asked for a place outside Alaska |
| U.S. Geological Survey (earthquake feeds) earthquake.usgs.gov | The real-time earthquake summary feeds on the Global Activity tab, read only while the tab is showing; an event's USGS page opens in your web browser | Nothing that names you or your place: only the feed's address, which names the window and magnitude you chose, and the App's User-Agent; like every request, it reveals your IP address; no place and no search text. Near your place is worked out on your PC. Cookies the site sets are not kept |
| NOAA National Centers for Environmental Information (historical event databases) www.ngdc.noaa.gov | History on the Global Activity tab: NOAA NCEI's records of significant earthquakes, tsunami sources and volcanic eruptions from its historical event databases, loaded page by page while History is on and the tab is showing (a complete saved copy younger than 30 days is used with no request) | Nothing that names you or your place: only the address of the page of records asked for (the kind of event and a page number) and the App's User-Agent; like every request, it reveals your IP address; no place and no search text. Cookies the site sets are not kept |
| U.S. Army Corps of Engineers (Inland ENC, hosted on Esri ArcGIS Online) services7.arcgis.com | Inland waterway reference data such as bridge clearances | The map area on screen |
| Federal Aviation Administration tfr.faa.gov, nasstatus.faa.gov, and FAA layers hosted on Esri ArcGIS Online (services6.arcgis.com) | Temporary flight restrictions, airport delay status, UAS Facility Maps and airspace layers | The map area or point you check |
| National Park Service (hosted on Esri ArcGIS Online) services1.arcgis.com | Park boundaries on the Drone check | The point you check |
| Iowa Environmental Mesonet, Iowa State University mesonet.agron.iastate.edu | Storm reports, archived warnings, upper-air soundings and watch details | The map area, time range or station requested |
| National Drought Mitigation Center, University of Nebraska-Lincoln (U.S. Drought Monitor) droughtmonitor.unl.edu, usdmdataservices.unl.edu | The weekly U.S. Drought Monitor map and its percent-of-area statistics on the Global tab | The week requested and, for statistics, the date range you choose |
| NOAA National Centers for Environmental Information www.ncei.noaa.gov | The Global tab's Climate at a Glance temperature and precipitation maps and time series, nClimGrid monthly grids and nClimGrid-Daily county values, global temperature departures, U.S. Climate Extremes Index and U.S. Percentage Areas, Palmer drought indices by climate division, the North American Drought Monitor monthly map pictures, GHCN-Daily and U.S. Climate Reference Network (USCRN) station observations, normals and monthly summaries, USCRN monthly values, state climate records (State Climate Extremes Committees), the Storm Events Database year files, radar-detected storm cells (Severe Weather Data Inventory, SWDI), historical tropical cyclone tracks (IBTrACS basin files) and the preview pictures of the dataset search | The product, index, variable, month, day, timescale, region or language you choose (the same files for everyone) and, for a state's chart, NCEI's state number and the baseline years you pick; for a station you click, its station id and the dates of the range you choose (USCRN: the station's file for the year, and for its monthly values the list of USCRN's monthly files and the station's monthly file); for Storm Events, the year file you agree to download; for radar-detected cells, the date and the map area on screen; for IBTrACS, the basin file you agree to download (and, when you press Check for updates, a request for that file's date and size); for a dataset preview, the dataset's picture address (the same for everyone), sent only when you press 'Show the preview picture'. Cookies the site sets are not kept |
| NOAA OneStop data.noaa.gov | Dataset search on the Global tab | The words you type in the search box, the date range if you set one, a keyword you pick from the search's own keyword list, and the map area on screen only when 'Search this map area' is on; for 'Show files in this area', the dataset you picked and the map area on screen. Your search words are sent only to NOAA OneStop, and the App does not save them. Cookies the site sets are not kept |
| NOAA CoastWatch West Coast Node ERDDAP (NMFS SWFSC Environmental Research Division) coastwatch.pfeg.noaa.gov | Daily (OISST) and monthly (ERSST) sea surface temperature grids on the Global tab, and their values over time at a point you click; OISST's sea-ice concentration when the U.S. National Ice Center's chart can't be used | The dataset, date and map area on screen; for a time series, the point you click (not your saved place unless you click there) |
| U.S. National Ice Center usicecenter.gov | Antarctic iceberg positions, IMS daily snow and ice (the 24 km grid, and the 4 km grid when you choose it), and the daily Arctic sea ice chart (marginal ice zone) on the Global tab; and the same sea ice chart on the Marine map for Alaska waters when you switch on its sea ice layer | Nothing about you: the same current files for everyone |
| NOAA NCEI elevation and bathymetry services gis.ngdc.noaa.gov | Shaded-relief elevation and sea-floor depth images, and the elevation at a point you click, on the Global tab | The map area on screen, or the point you click (not your saved place unless you click there) |
| University of Alabama in Huntsville (UAH) www.nsstc.uah.edu | UAH satellite upper-air temperature anomalies (MSU/AMSU version 6.1) on the Global tab | Nothing about you: the same files for everyone |
| U.S. Census Bureau bundled in the app (no request) | City search, from the Census Gazetteer place list built into the App, and the state and county outlines for the Global tab's maps, built into the App (2024 cartographic boundary files) | Nothing: the search runs on your device |
| Natural Earth bundled in the app (no request) | The world land and country lines of the Global tab's world view, built into the App (Natural Earth 1:50m data, public domain; made with Natural Earth, naturalearthdata.com) | Nothing: the outlines are built into the App |
| NOAA National Centers for Environmental Information (bundled outlines and lists) bundled in the app (no request) | The climate-division outlines of the Global tab's maps, the GHCN-Daily station list (U.S. and territories) and the U.S. national records of the National Climate Extremes Committee, built into the App | Nothing: the outlines and lists are built into the App |
5. More
The Terms of Use (section 6) and the Privacy Policy (section 3) give the full details. Open-source components and their licenses are listed under Third-party notices.